![]() Figure 14 of
Johnson, Mol Vis 2007;
13:887-919.
Figure 14 of
Johnson, Mol Vis 2007;
13:887-919.
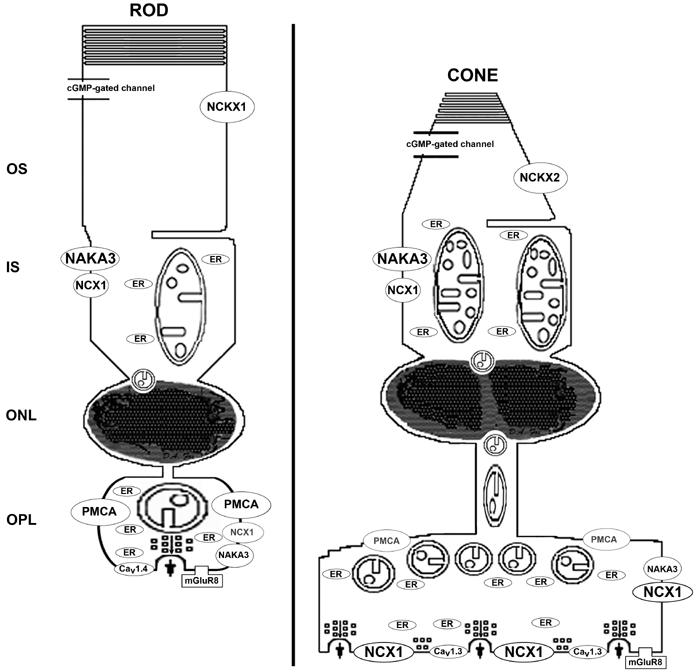
Figure 14. Summary diagram of the mouse rod and middle wavelength (M) cone ribbon synapses
The diagram summarizes our current findings, includes results from our work on mouse rod and cone photoreceptor inner segment (IS) mitochondria [55], and highlights the results from numerous other investigators. It compares the location, distribution and morphology of the major cellular components involved in regulating ATP and Ca2+ homeostasis, and presynaptic glutamate release. The size and/or color of the lines, ellipses, letters and mitochondria reflect differences in activity determined by histochemistry or electrophysiology, protein density as visualized with immunolabeling, and number or morphology as determined electron microscopy and electron tomography. The relatively thicker lines and larger ellipse in the cone outer segments (OS), compared to ROS, indicate the cone's higher relative permeability for Ca2+ through the cGMP-gated channel, higher fraction of the dark current carried by Ca2+ and more rapid Na+/Ca2+-K+ exchanger (NCKX2 in cones compared to NCKX1 in rods): [59-61,112,184]. RIS have an average of about 5 mitochondria per cross sectional area, whereas CIS have about 10 mitochondria per cross sectional area resulting in a cone to rod ratio of 2:1 [55]. The mouse RIS and CIS mitochondria are in the orthodox, rather than the condensed, conformation [55]. The mean cristae junction diameter of the RIS and CIS mitochondria is 17 and 12 nm, respectively, [55]. CIS mitochondria are more uniformly stained and reactive for cytochrome c oxidase than RIS mitochondria [55]: depicted here as darkened inner mitochondrial membrane and cristae. Both RIS and CIS contain numerous small calreticulin- and SERCA3-positive smooth endoplasmic reticulum cisternae/vesicles (Figure 6, Figure 9B,D): several are closely associated with mitochondria (Figure 6B,E): herein labeled ER. Photoreceptor IS are weakly immunoreactive for PMCA (Figure 6A). NCX isoform 1 (NCX1) immunolabeling was intense in both RIS and CIS, although it is stronger in the latter (Figure 7D). In monkey retina, CIS had more intense immunolabeling for Na+,K+-ATPase (NAKA) than RIS [40]: likely the NAKA α3 isoform (NAKA3) [101,167]. Similar data is not yet available in the mouse retina. In the most proximal rows of the ONL, a juxtanuclear mitochondrion sits above individual rod nuclei (Figure 2A,D and Figure 4). In the most distal ONL, a pair of previously undescribed juxtanuclear mitochondria localizes above and below the cone nuclei (Figure 2-Figure 4). The rod spherule contains one large mitochondrion. Cone pedicles have about 5 mitochondria per cell resulting in a cone to rod ratio of 5:1 (Figure 9 and Figure 10). The synaptic terminal mitochondria of rods and cones are in the orthodox or energized conformation (Figure 10). The mitochondria in the cone pedicle cluster near top of the terminal, where the axon enters the pedicle (Figure 7, Figure 8D-E, Figure 9B, and Figure 10B). The mean cristae junction diameter of the rod spherule and cone pedicle mitochondria is 12 and 9 nm, respectively, (Table 3). Mouse cone pedicles are more reactive for cytochrome c oxidase than rod spherules (same style depiction as above; Fox, unpublished data), as described for other mammalian retinas [47,62]. Rod and cone synaptic terminals contain numerous small calreticulin- and SERCA3-positive smooth endoplasmic reticulum cisternae/vesicles (small gray ellipses): several are closely associated with mitochondria (Figure 6, Figure 9B,D). Rod spherules intensely label for PMCA, whereas cone pedicles exhibit minimal labeling that localizes at the top of the pedicle (Figure 7B-C, Figure 8D,E). Cone pedicles label intensely and uniformly for NCX1, whereas rod spherules label weakly and more diffusely (Figure 7D-F and Figure 8). Rod spherules have one synaptic invagination (Figure 9), although about 5% had two ribbon synaptic units (Figure 9B) as described [153,185]. Cone pedicles have 6-14 synaptic invaginations (Figure 8: Fox, unpublished data). In the dark-adapted mouse retina, Ca2+ enters rod and cone synaptic terminals through voltage-gated L-type calcium channels Cav1.4 (formerly α1F) and Cav1.3 (formerly α1D), respectively [160,161] and glutamate is continuously released. Moreover, in the dark-adapted mouse retina the rod spherules maintain a significantly lower free [Ca2+] than cone pedicles (Figure 13; Table 4). In contrast, during light adaptation the cone pedicles more rapidly, efficiently and completely lower their free [Ca2+] compared to the rod spherules (Figure 13; Table 4). The group 3 metabotropic glutamate receptor mGluR8 is present on the presynaptic terminals of rod and cone photoreceptors [186]. It likely provides negative feedback control on glutamate release and serves to prevent Ca2+ overload [39,40,94] by down-regulating the intraterminal Ca2+ levels [186]. The implications of the above findings related to rod spherule and cone pedicle bioenergetics, Ca2+ homeostasis, apoptosis and neurotransmission are discussed in the text.
