![]() Figure 13 of
Johnson, Mol Vis 2007;
13:887-919.
Figure 13 of
Johnson, Mol Vis 2007;
13:887-919.
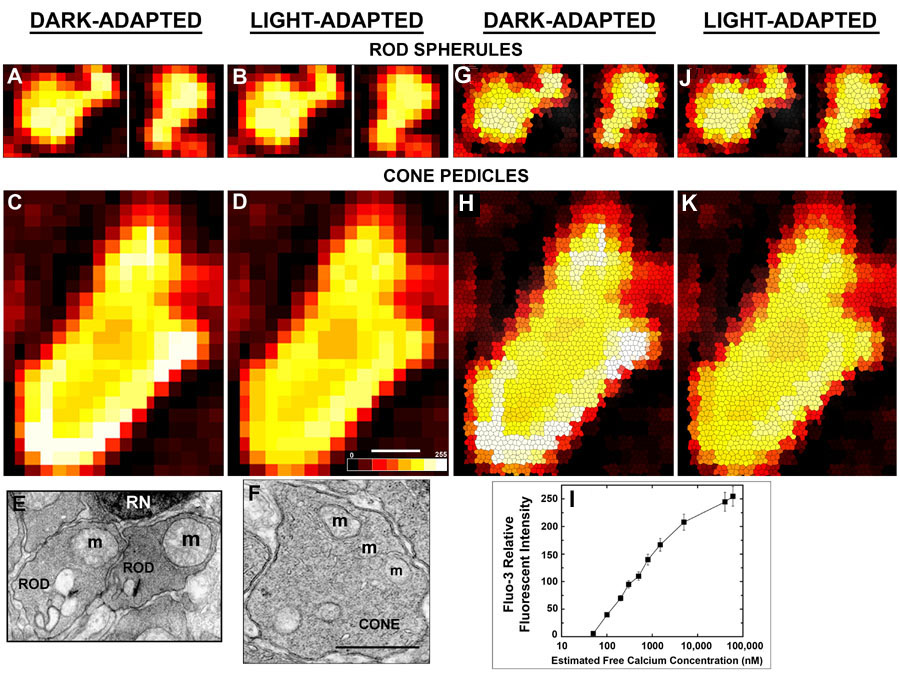
Figure 13. Ca2+ imaging and correlative electron microscopy of rod and cone synaptic terminals in dark-adapted and light-adapted retinas
A-D: Pseudocolored Ca2+-fluo-3 confocal images obtained from an adjacent pair of rod spherules (A, B) and a single cone pedicle (B and D) during dark adaptation (A and C) and light-adaptation (B and D). Scale bar equal 1 μm. The pseudocolor scale represents pixel intensity from 0 to 255 gray levels. The RFI values and estimated free [Ca2+] in dark-adapted rod spherules were lower than in cone pedicles, whereas the RFI values and estimated free [Ca2+] in light-adapted cone pedicles were markedly lower than in light-adapted rod spherules (Table 4). During light adaptation, the cone pedicles lowered their intraterminal [Ca2+] about 3 fold more than rod spherules (Table 4). G-K: For higher resolution and better visualization of the Ca2+ microdomains, the pseudocolored images were transformed using an advanced image synthesis algorithm. The microdomains of high [Ca2+] were larger and closer to the plasma membrane in dark-adapted cone pedicles (C and H) compared to rod spherules (A and G). The scale bar and pseudocolor scale are as presented in D. E and F: The electron micrographs of the rod spherules E and cone pedicle F correspond to the rod spherules in panels A and B and cone pedicle in C and D, respectively. RN: rod nuclei, m: mitochondrion. Scale bar equal 1 μm for both panels. I: A fluo-3 Ca2+ calibration curve used to estimate the free [Ca2+] in the photoreceptor synaptic terminals (see Table 4).