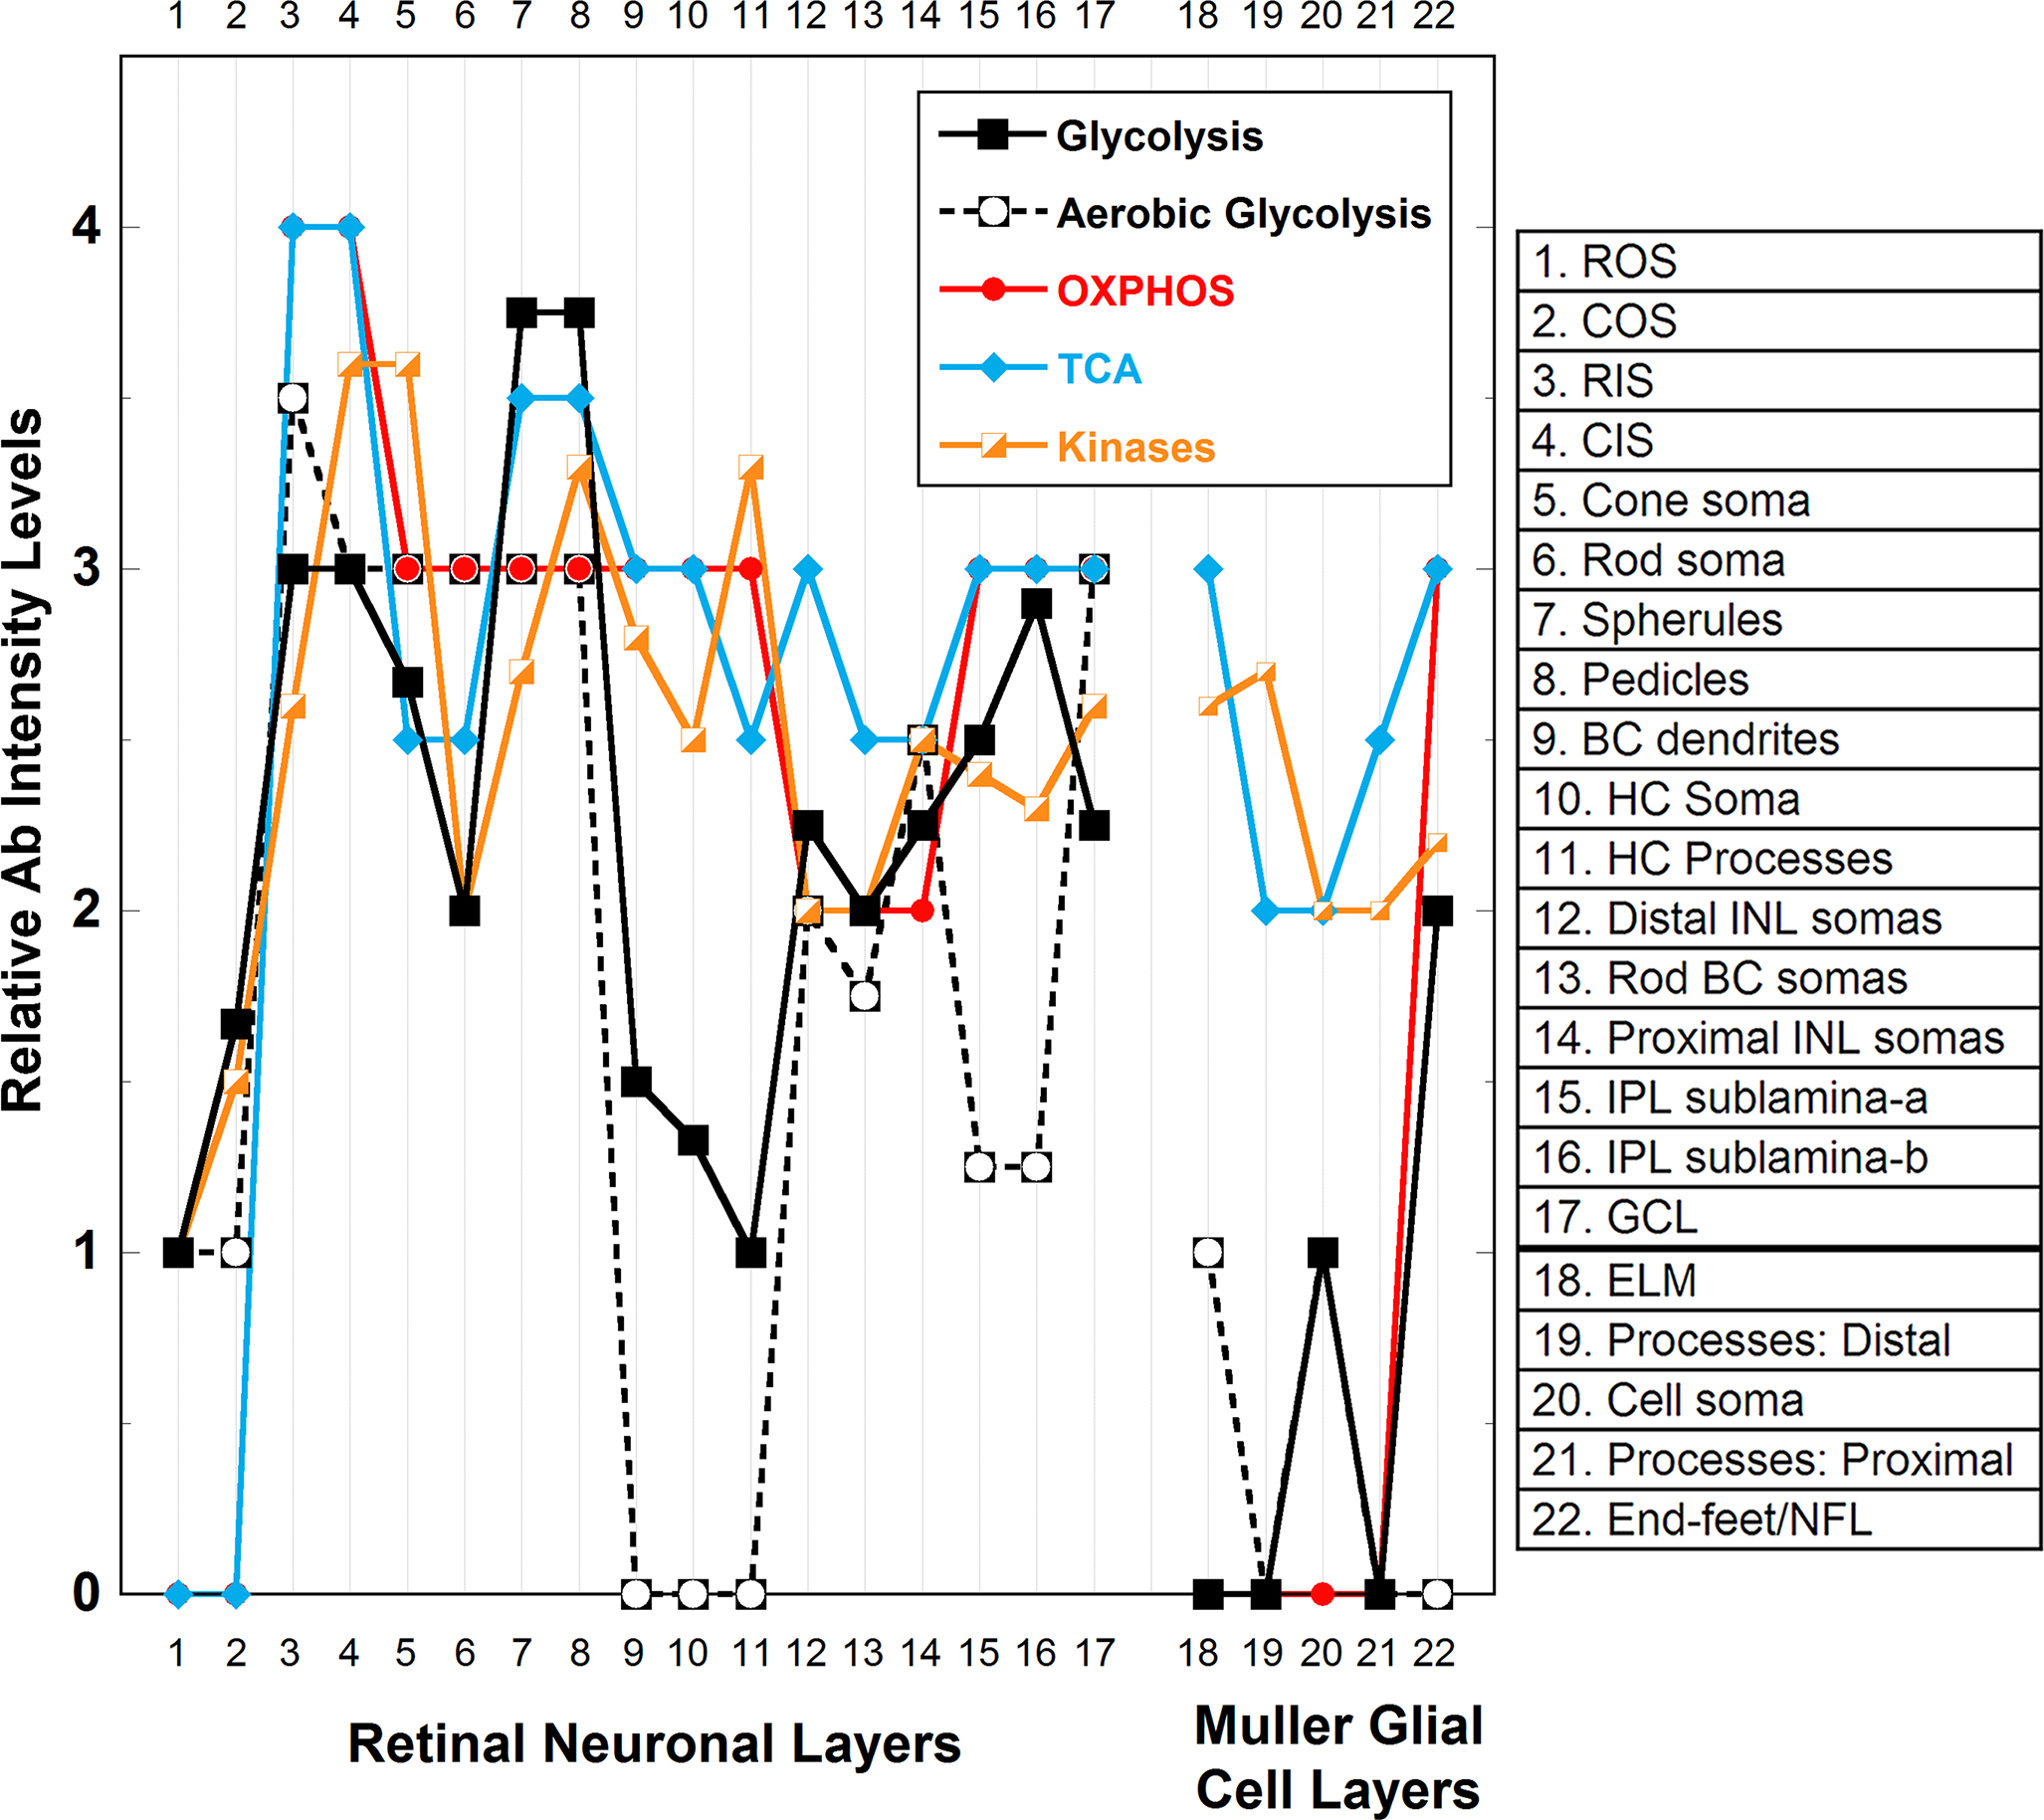
Figure 16. Integrated summary of relative Ab intensity levels obtained from the immunoreactivity of bioenergetic regulating and buffering
enzymes in the neuronal and glial compartments of the adult light-adapted C57BL/6N mouse retina. The numbers on the x-axis
(from 1 to 22) indicate the specific retinal compartments (see key). The values on the y-axis represent the integrated mean
relative intensity values of immunoreactivity levels for enzymes that regulate glycolysis (HK-1, HK-2, PFK-L1, PK-M1, and
PK-M2), aerobic glycolysis (pan-LDH and LDH-5), the tricarboxylic acid (TCA) cycle (OGDH and STK), oxidative phosphorylation
(OXPHOS; cytochrome c oxidase subunit IV, COX IV), and the ~P transferring kinases (NDPK, AK1, AK2, CK-B, CK-M, and mi-CK)
obtained from Appendix 1. Overall, the findings reveal highly compartmentalized and graded expression levels of the different
enzymes in the outer compared to the inner retina as well as in the Müller glial cells (MGCs) compared to the neurons. Glycolytic
enzymes (solid black squares and line) are higher in the outer retina than in the inner retina, except in the rod and cone
outer segments (ROSs; COSs). Specifically, the highest levels (i.e., ≥3 on intensity scale) are in the rod and cone inner
segments (RISs; CISs), rod spherules, and cone pedicles where most of the retinal mitochondria are located [
7,
9]. Enzyme levels are slightly lower (i.e., 2.5–3.0) in the cone somas, the inner plexiform layer (IPL), the IPL sublamina-a,
and sublamina-b (IPL-a; IPL-b) and still lower (i.e., 2.0–2.5) in the rod somas, inner nuclear layer (INL) somas, ganglion
cell layer (GCL), and MGC end-feet/nerve fiber layer (NFL), and lowest (i.e., 1.0–1.75) in the ROS and COS, bipolar cell (BC)
dendrites, horizontal cell (HC) somas and processes, and MGC somas. No glycolytic enzyme immunoreactivity was detected in
the MGC external limiting membrane (ELM) or processes. Similar to glycolysis, aerobic glycolysis is higher in the outer retina
than in the inner retina, except again for the ROSs and COSs. Compared to the RIS, aerobic glycolysis is just slightly lower
in the CISs, rod and cone somas, and spherules and pedicles, as seen with the lactate dehydrogenase (LDH) activity (
Figure 8). The BC dendrites, HC somas, and HC process have no apparent aerobic glycolytic capacity. Except amacrine cells in the proximal
INL and the GCL, aerobic glycolysis is low (i.e., 1.0–2.0) in the inner retina. Aerobic glycolysis is absent to low (i.e.,
≤1.0) throughout the MGCs. OXPHOS capacity is present and relatively high in all outer and inner retinal compartments, except
in the ROS and COS (no COX IV or COX activity detected) and the INL somas (i.e., ≤2.0). As the IS showed high expression of
GDH1 (
Figure 10) and the inner retinal neurons had the highest GLS expression levels (
Figure 4), the high OXPHOS capacity in these compartments may be supported by non-glucose derivatives. Except the MGC end-feet/NFL,
OXPHOS capacity was not detected in any MGC compartments, consistent with the COX activity (
Figure 9) and [
9]. In the outer retina, the TCA cycle expression profile essentially mirrors that of OXPHOS. In the inner retina, except in
the INL somas, the TCA cycle expression is moderately high (i.e., 2.5 to 3.0) and mirrors that of OXPHOS. The TCA cycle expression
profile in MGCs is characterized by moderate to high expression (i.e., 2.5 to 3.0) in the ELM, proximal processes, and end-feet/NFL
and lower expression (i.e., 2.0) in the distal process and somas. This is in marked contrast to their expression of enzymes
related to glycolysis, aerobic glycolysis, and OXPHOS. MGCs also have a capacity for glutamate and GABA catabolism, as well
as GTP production (
Figure 10). Together, this suggests that MGCs support their bioenergetics demands using non-glucose derivatives to generate GTP. The
~P transferring kinases were differentially distributed among all compartments of the inner and outer retinal neurons. The
~P transferring kinases were more highly expressed in all cone compartments (CIS, somas, and pedicles, i.e., 3.5) compared
to similar rod compartments (i.e., 2.0–2.5). The ~P transferring kinases were also moderately to highly expressed in the BC
dendrites, HC somas, and HC processes, compartments that had low glycolytic and/or aerobic glycolytic capacity. In the MGCs,
the ~P transferring kinases were moderately expressed in the ELM and distal processes and had lower expression (i.e., ≥2.0)
the somas, proximal processes, and end-feet/NFL. As the MGCs lack OXPHOS capacity, except in the end-feet/NFL, the ~P transferring
kinases likely convert the GTP produced in the TCA cycle to ATP, as well as buffer the ATP concentration.
 Figure 16 of
Rueda, Mol Vis 2016; 22:847-885.
Figure 16 of
Rueda, Mol Vis 2016; 22:847-885.