Figure 8. LDH histochemistry of the light-adapted mouse retina. Different concentrations of sodium DL-lactate showed selective activity
of lactate dehydrogenase (LDH) in the ISs. A: Retinas incubated in the absence of the sodium DL-lactate. No LDH reactivity is observed. B: Retinas incubated with 1 mM sodium DL-lactate show LDH activity in the IS. C: Retinas incubated in 5 mM sodium DL-lactate show high LDH activity in the ISs and low LDH activity in the OPL. D: Retinas incubated in 10 mM sodium DL-lactate show intense LDH activity in the IS and strong LDH activity in the OPL, INL,
and GCL. E: Retinas incubated in the absence of sodium DL-lactate and 1 mM sodium pyruvate. F and G: Retinas incubated with equimolar concentrations of sodium DL-lactate and sodium pyruvate show selective LDH activity in
the ISs. H: Retinas incubated with 10 mM sodium DL-lactate and 5 mM sodium pyruvate show reduced activity of LDH in most retinal layers
except the ISs. I: LDH activity in different retinal layers presented as mean ± SEM of relative optical density. The LDH activity in ISs was
significantly greater at each concentration of lactate relative to the other retinal layers as indicated by asterisks (p<0.05).
Bars for each retinal layer that share the same letter (a, b, c, or d) exhibit significant concentration-dependent increases
in LDH activity with increasing concentration of lactate (p<0.05). GCL = ganglion cell layer, INL = inner nuclear layer, IPL
= inner plexiform layer, ISs = inner segments, NFL = nerve fiber layer, ONL = outer nuclear layer, OPL = outer plexiform layer.
Scale bar = 20 μm.
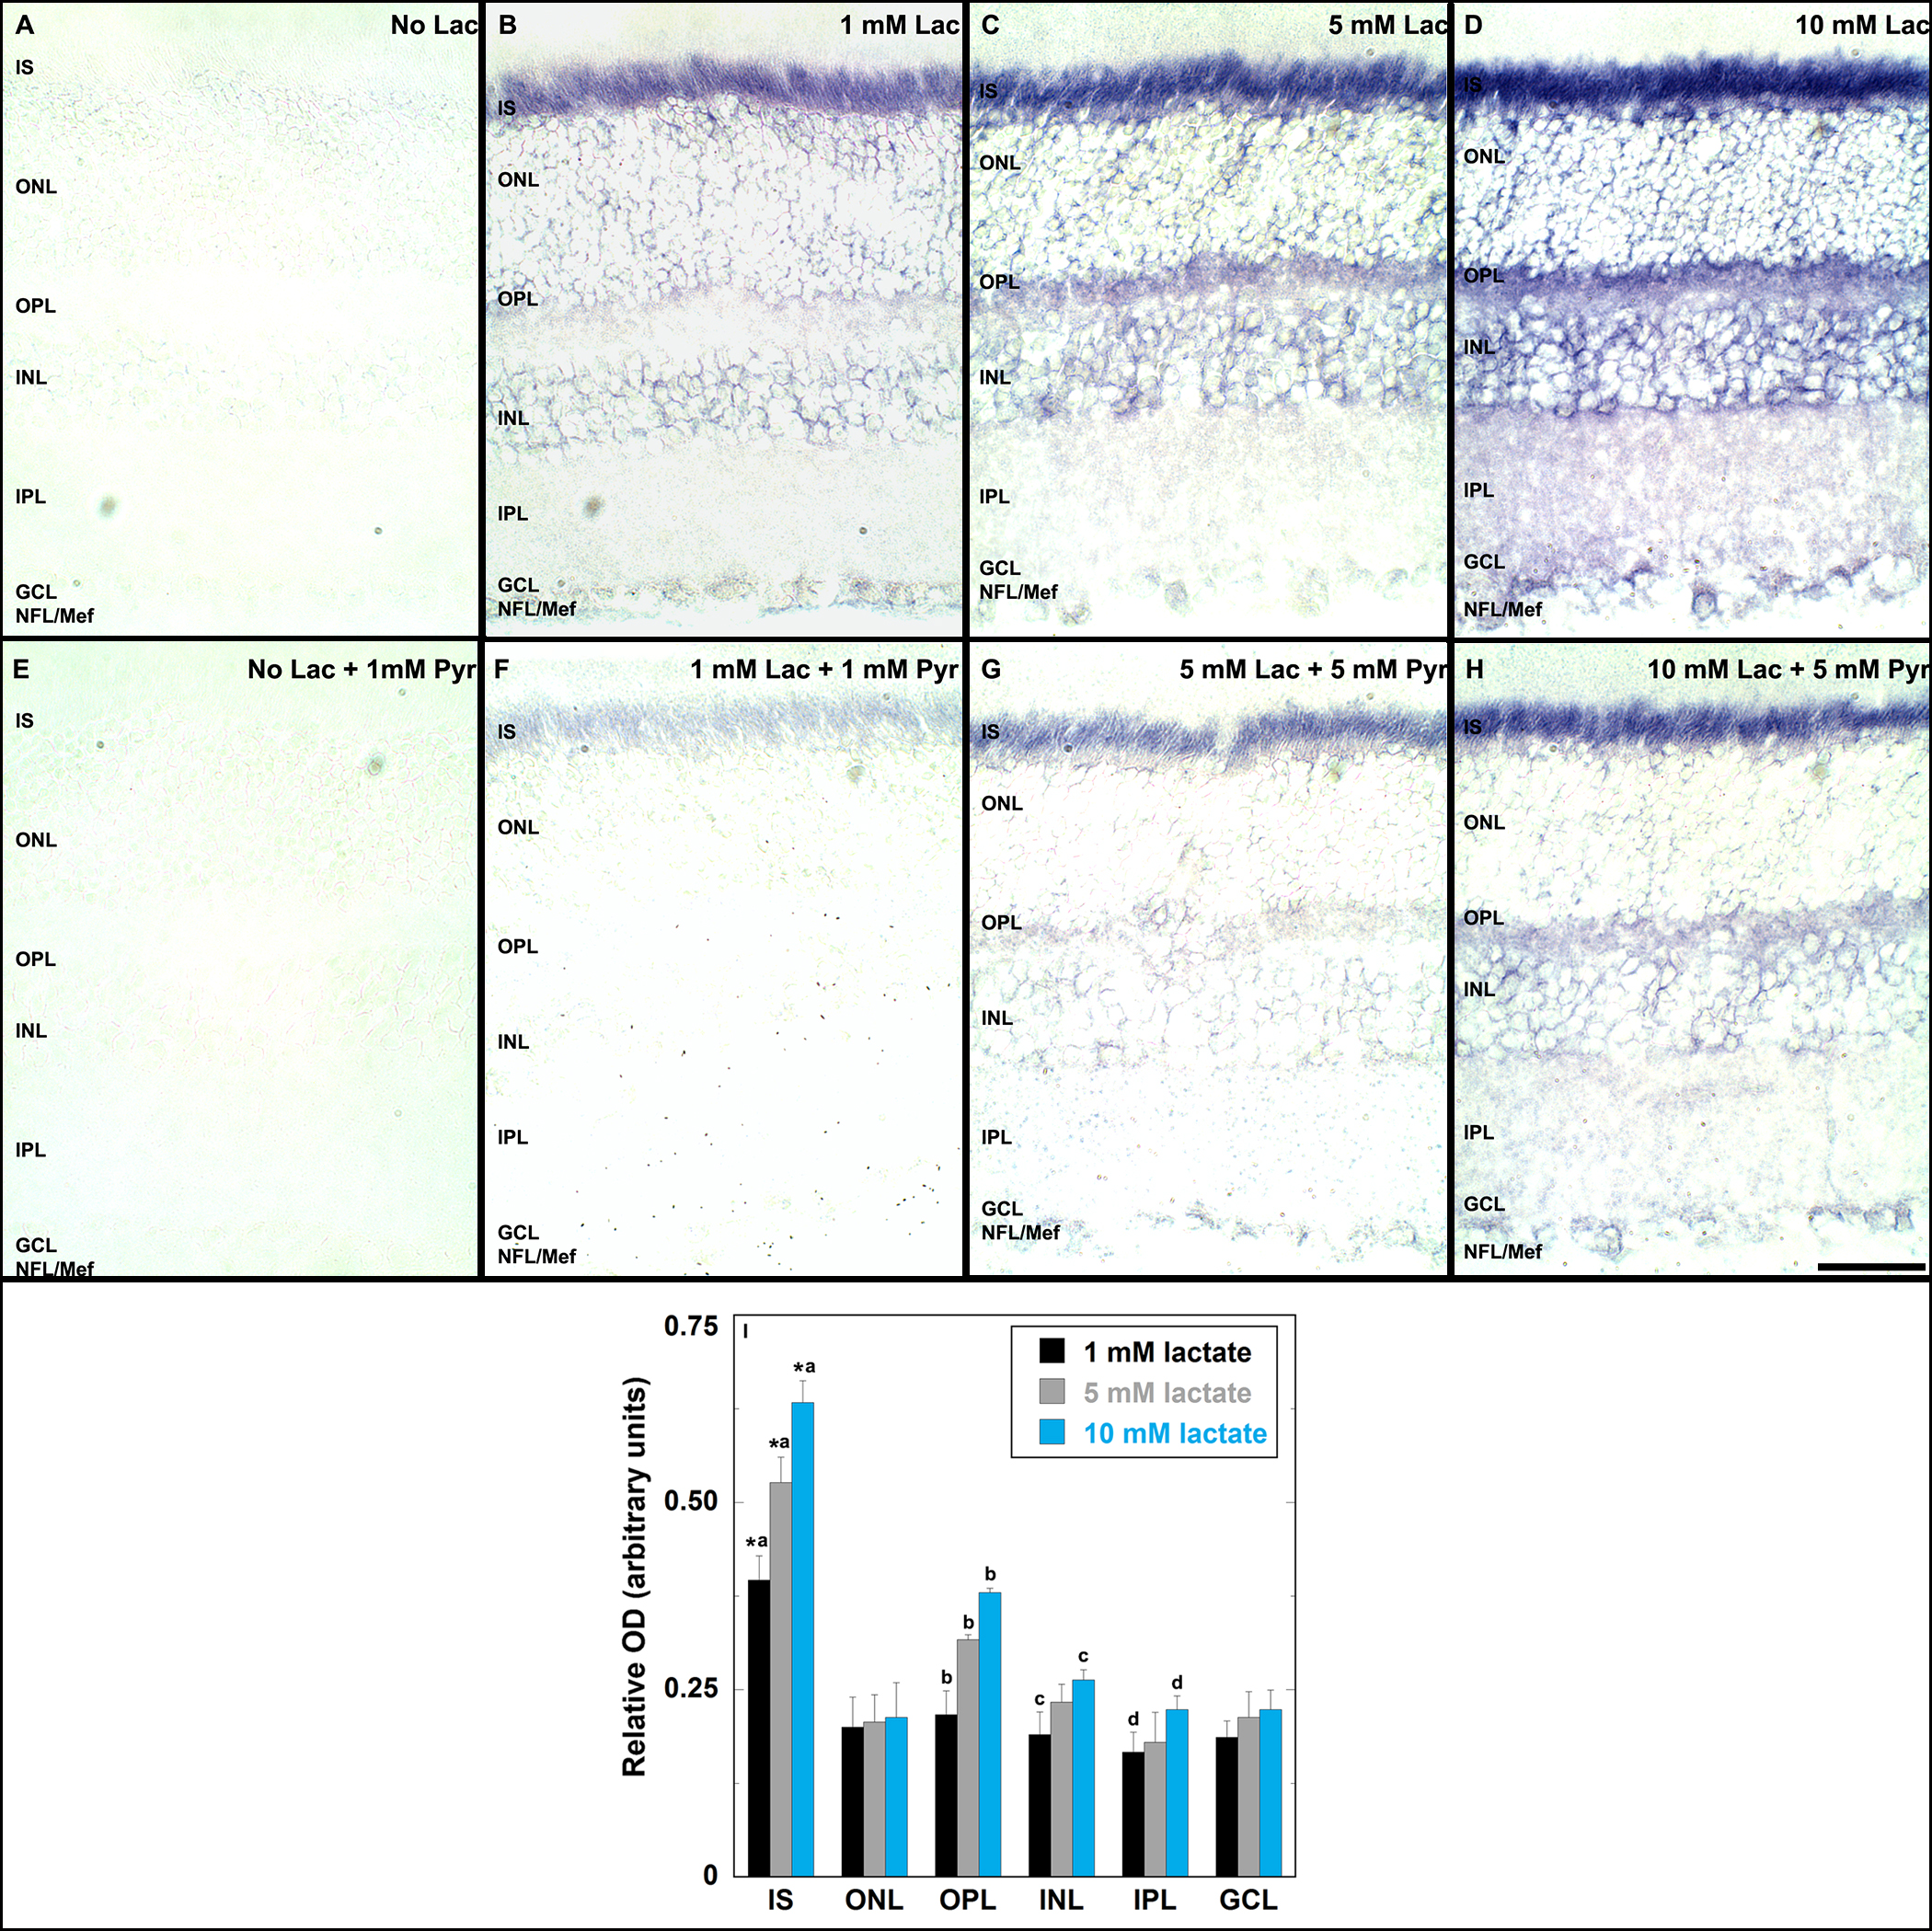
 Figure 8 of
Rueda, Mol Vis 2016; 22:847-885.
Figure 8 of
Rueda, Mol Vis 2016; 22:847-885.