Figure 4. Confocal images reveal that photoreceptors intensely express HK-2 in the IS and the ONL compartments with mitochondria. A–C: High magnification images of the IS ellipsoid and myoid regions and the distal ONL immunolabeled for (A) HK-2, (B) COX IV, and (C) HK-2 and COX IV. Colocalization in the ellipsoids of the rods and cones and in the cone perinuclear mitochondria (white
arrowheads) is visible (yellow-orange pixels). D–F: High-magnification images of the OPL immunolabeled for (D) HK-2, (E) HK-2 and COX IV, and (F) HK-2 and pan-plasma membrane Ca2+ ATPase (pan-PMCA). Colocalization is visible in the rod spherules (yellow-orange pixels) and the larger cone pedicles (green
pixels: white arrows). High-magnification images of the OPL immunolabeled for (G) COX IV and VGLUT1, (H) GLS and VGLUT1, (I) and GLS and PKCα. Colocalization of GLS and PKCα is visible in the dendrites and somas of the rod bipolar cells (yellow-orange
pixels). COX IV = cytochrome c oxidase subunit IV, ellip = ellipsoid, INL = inner nuclear layer, ISs = inner segments, myo
= myoid, ONL = outer nuclear layer , OPL = outer plexiform layer, GLS = glutaminase, PKCα = protein kinase C α , VGLUT1 =
vesicular glutamate transporter 1. A–C, scale bar = 10 µm. D–G, scale bar = 20 µm. H and I, scale bar = 40 µm.
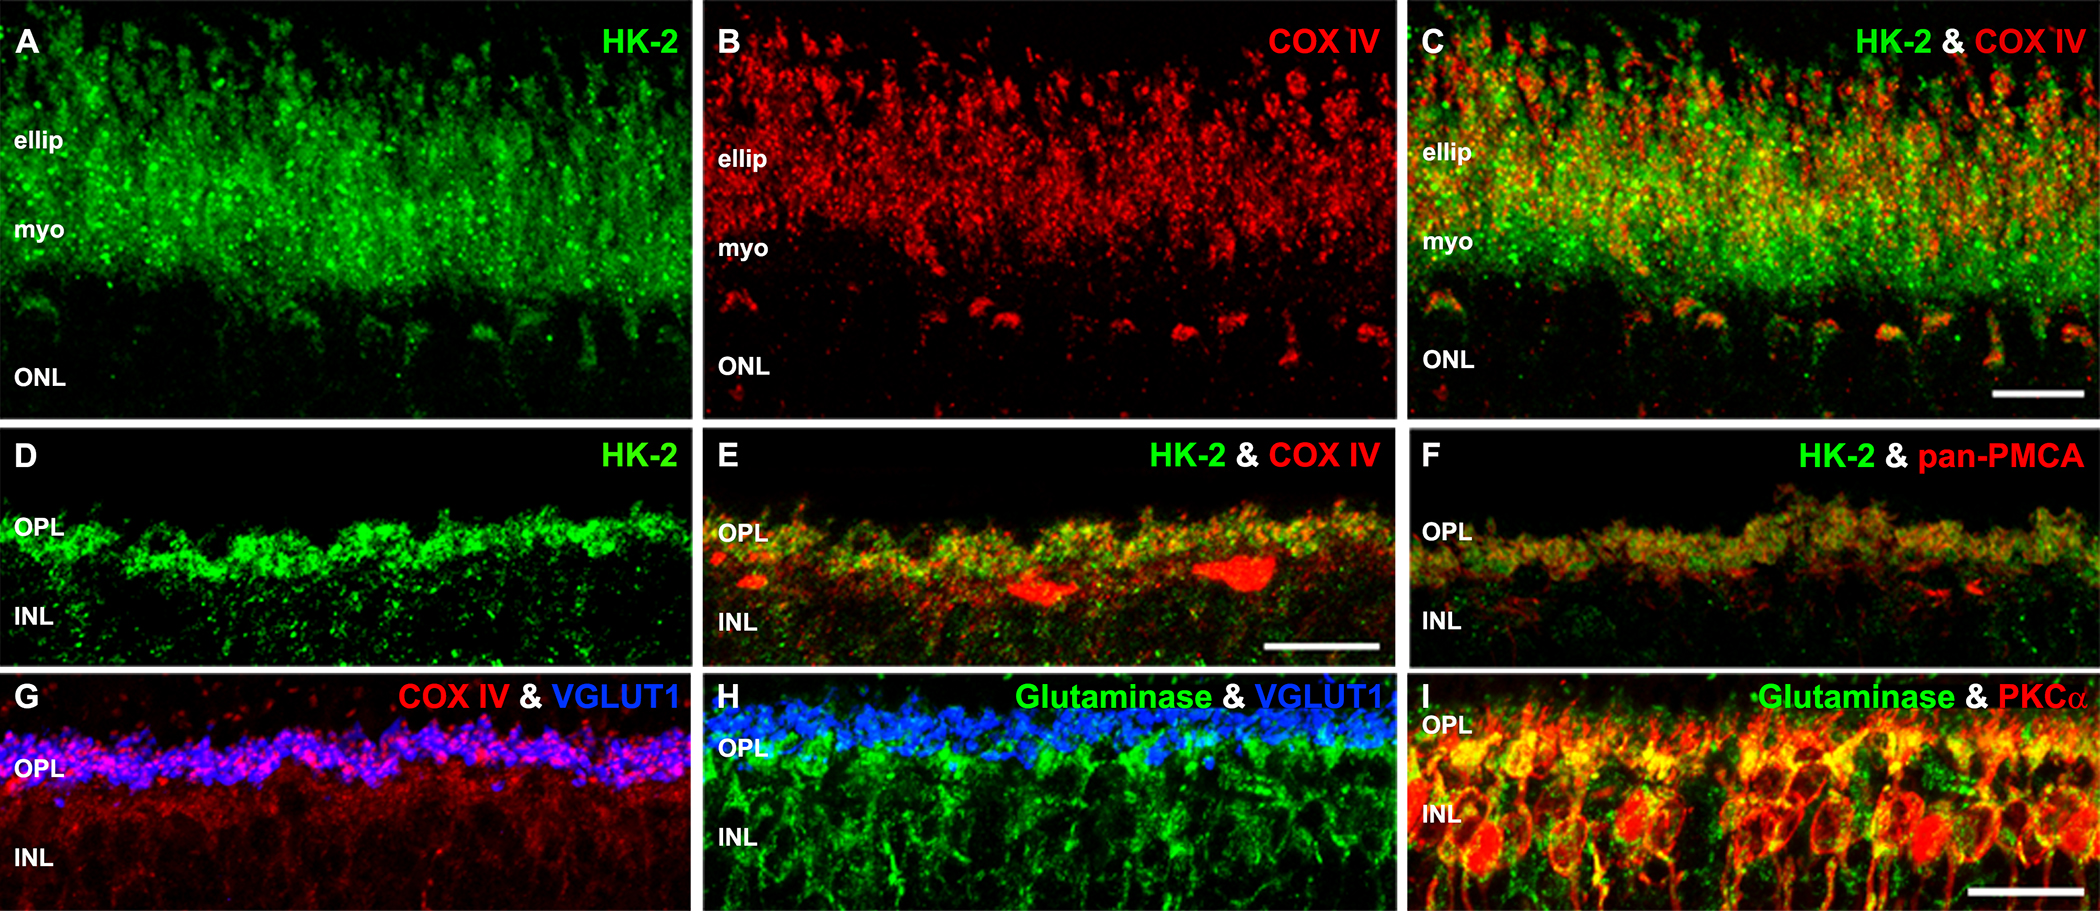
 Figure 4 of
Rueda, Mol Vis 2016; 22:847-885.
Figure 4 of
Rueda, Mol Vis 2016; 22:847-885.