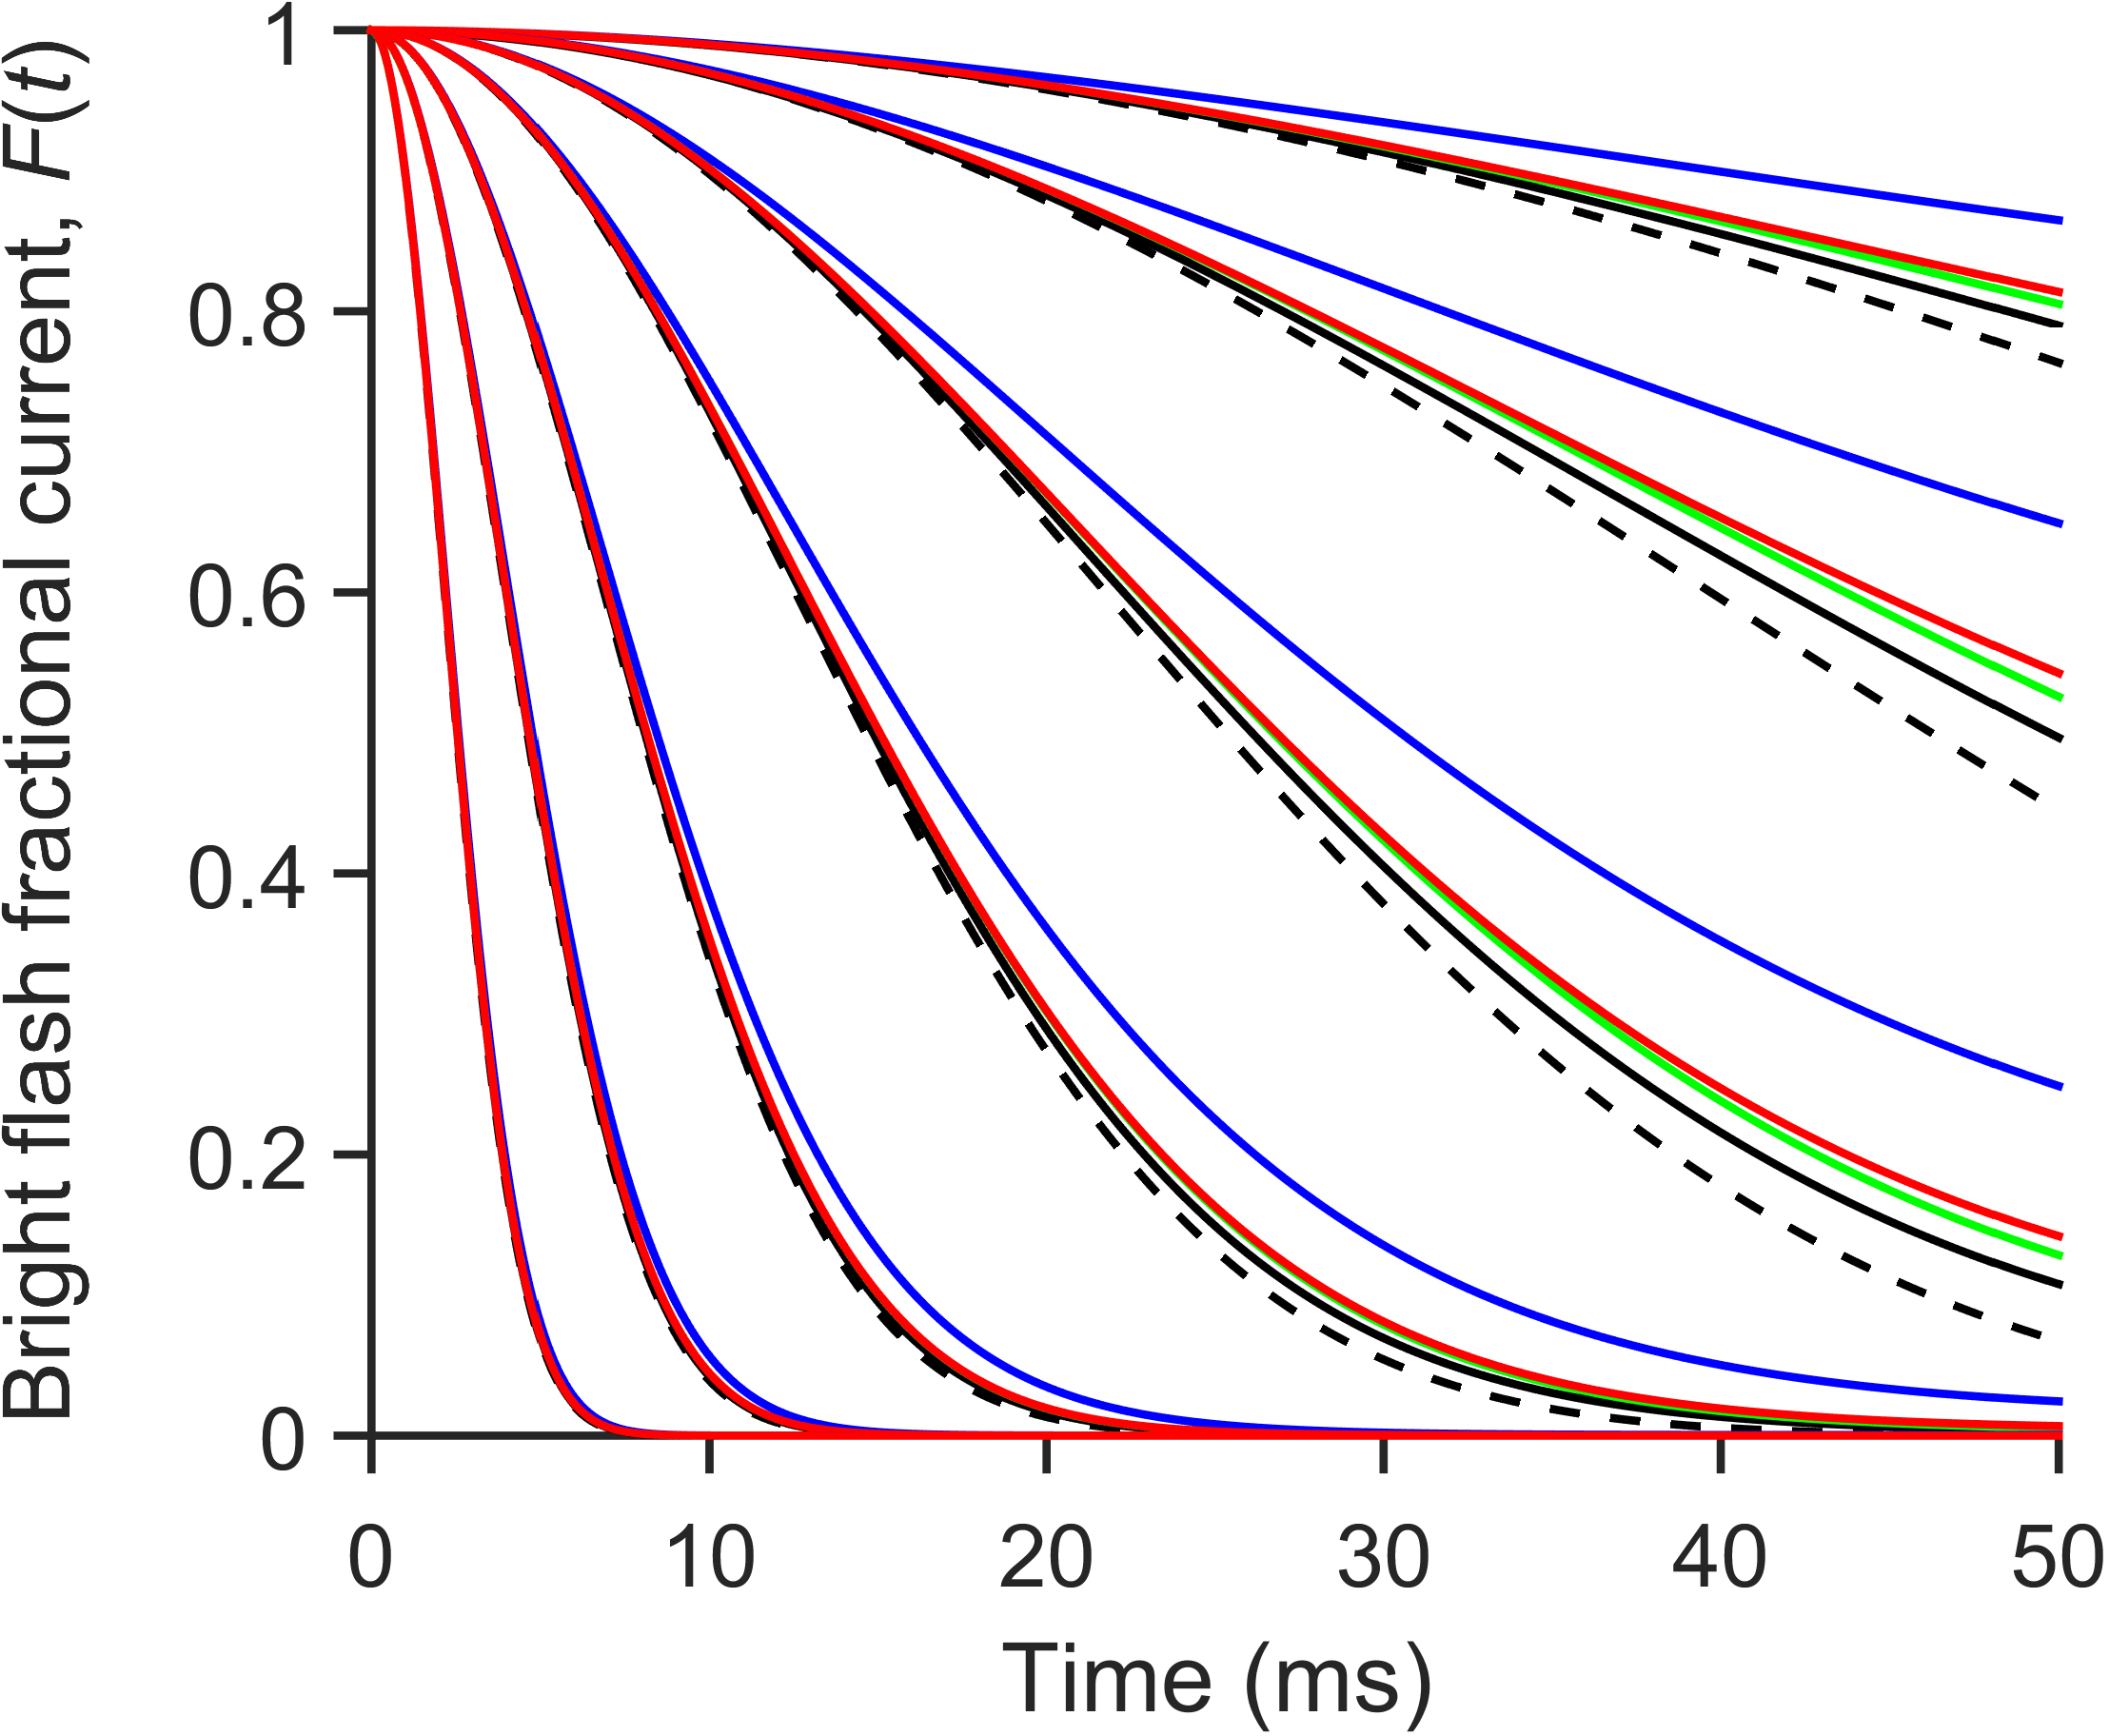
Figure 7. Predicted bright flash responses. Bright flash responses are predicted under five sets of conditions, indicated by the different
colors. Black traces: No shut-off of either R* or G*/PDE*. The dashed black trace plots the Gaussian analytical expression
of Lamb and Pugh [
1]; the continuous black trace plots the solution of the differential equations (with
kR* = 0 and
kE = 0). Green traces: With normal shut-off of G*/PDE* but no shut-off of R*, achieved by setting
kR* = 0 but leaving
kE as in
Table 2. Red traces: Three-state model of R* shut-off, with parameters as in the Tables and
Figure 4. Here, the mean R* time course was calculated by numerical integration of the differential equations representing the reactions
in
Figure 1E. Blue traces: Exponential decay of mean R* activity, with a time constant
kR*−1 = 40 ms. At higher intensities, some traces are obscured by overlying traces, which were plotted in the sequence black, green,
red, blue. For all traces except the Gaussian analytical model, the downstream reactions were integrated using the lumped
model versions of Equations (4.1) – (4.9), with the default parameters in
Table 2 (except where
kE was set to zero). In all cases, the gain factor ν
RE β
sub was set to 7.2 s
−2 (giving an amplification constant of
A = 21.6 s
−2), the flash duration was zero, and the flash intensities were 10, 30, 100, 300, 1000, 3000, and 10,000 photoisomerizations.
 Figure 7 of
Lamb, Mol Vis 2016; 22:674-696.
Figure 7 of
Lamb, Mol Vis 2016; 22:674-696.