![]() Figure 5 of
Robinson, Mol Vis 2006;
12:704-711.
Figure 5 of
Robinson, Mol Vis 2006;
12:704-711.
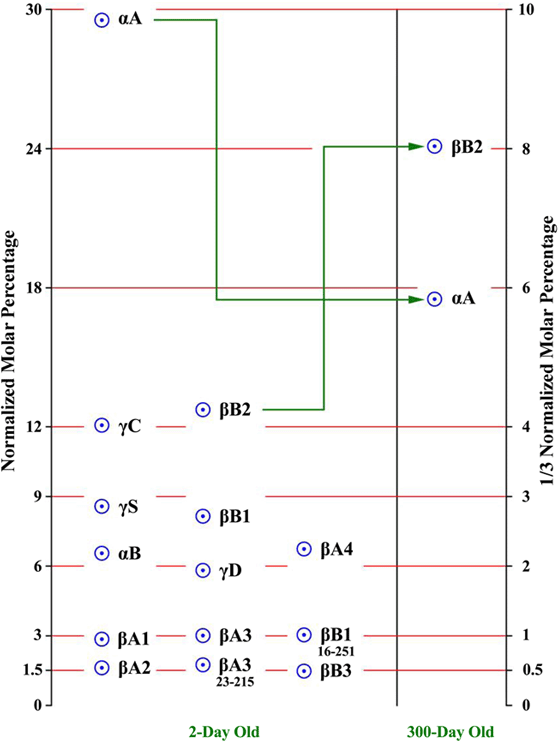
Figure 5.
Median molar percentages of the 14 crystallins in the lenses of four 2-day-old human donors and one 300-day-old donor. The percentage values are seen to be clustered in six groups including βA2-, βA3-22-, and βB3-crystallin; βA1-, βA3-, and βB1-15-crystallin; αB-, γD-, and βA4-crystallin; γS- and βB1-crystallin; γC- and βB2-crystallin; and αA-crystallin. The means and standard deviations of these groups are listed in Table 2 and further summarized in Table 3. They show even integral relationships to one another as illustrated by the 0 to 30 and 0 to 10 integer axes and red lines. Since βA3-22- and βB1-15-crystallin are truncated forms βA3- and βB1-crystallin, an alternative treatment would be to combine these respective pairs. When this is done, the integer relationships remain, while the respective positions in the integer array are changed as described herein. It is likely that the integral relationships between the crystallins shown in Figure 5 reflect the structures of ordered arrays of crystallins in lens fiber cells. If so, the translation messages required to synthesize the crystallins would also reflect these ratios and would correspond to characteristics of the individual crystallins and their intramolecular lens structures. The changes for αA-crystallin and βB2-crystallin are equal, offsetting, and comparable to the lens growth expected between 2 and 300 days. They may reflect a substitution of βB2-crystallin for αA-crystallin in lens arrays constructed after birth. The change shown for the 300-day-old lens is further verified by the trend of values for other older lenses as shown in Figure 3 and Figure 4.