![]() Figure 4 of
Robinson, Mol Vis 2006;
12:704-711.
Figure 4 of
Robinson, Mol Vis 2006;
12:704-711.
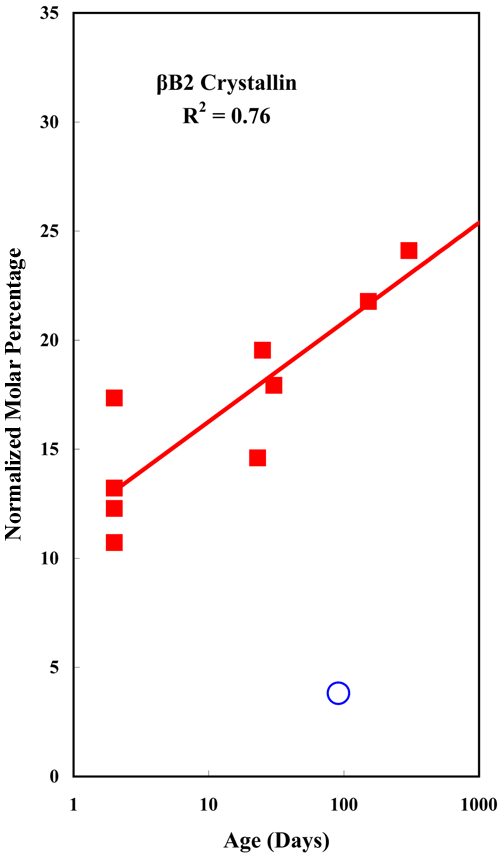
Figure 4.
Linear plot of the mole percentage of βB2-crystallin as a function of logarithm of age during the first year after birth. The percentage of βB2-crystallin rises from 12% at age 2 days to 24% at age 300 days. This is quantitatively compensated by a decrease in αA-crystallin as shown in Figure 3. The open circle shows the value for the 90-day-old donor, which was excluded from the trend line and R2 calculation. This value is quite different from the others and may reflect unique biological variation.
