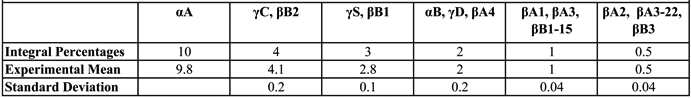
Table 2 of Robinson, Mol Vis 2006; 12:704-711.
Table 2.
Mean and standard deviation percentage values for the six groups of crystallins illustrated in Figure 5. These means and variances show that these six groups are quantitatively distinct.