![]() Figure 5 of
Beattie, Mol Vis 2005;
11:825-832.
Figure 5 of
Beattie, Mol Vis 2005;
11:825-832.
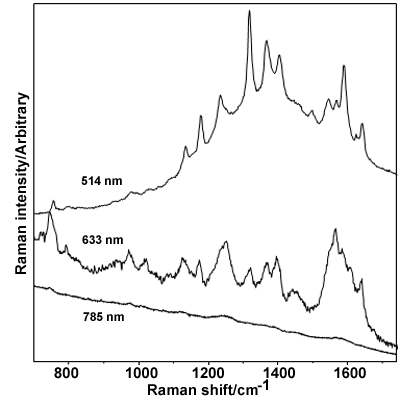
Figure 5. Raman spectra of cytochrome c exciting at 785, 633 and 514 nm
Raman spectra of crystalline horse heart cytochrome c acquired using 785, 633, and 514 nm excitation. The wavelength-dependent enhancement from 785 nm, 633 nm, 514 nm of the groups of features in the wavenumber ranges 1330-1400 cm-1 approximately and 1500-1630 cm-1 should be compared with the corresponding sets of features in the PIS spectra recorded at the same excitation wavelengths in Figure 1 (785 nm), Figure 3 (633 nm), and Figure 4 (514 nm).
