![]() Figure 3 of
Beattie, Mol Vis 2005;
11:825-832.
Figure 3 of
Beattie, Mol Vis 2005;
11:825-832.
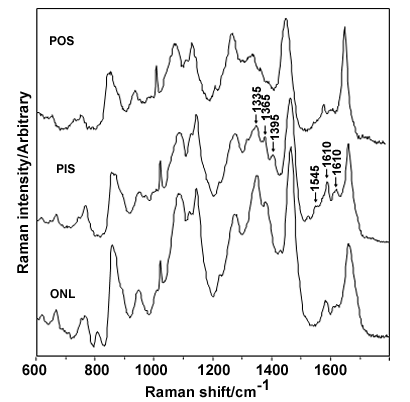
Figure 3. Raman spectra of the outer segments of porcine retina recorded using an excitation wavelength of 633 nm
Raman spectra of the outer segments of the retinal section were acquired using 633 nm excitation. The labeled modes are discussed in the text. The pattern of three main bands seen in the photoreceptor inner segment spectra in the region from 1500-1630 cm-1 and a similar pattern in the 1330-1400 cm-1 region are apparently the result of resonance enhancement at 633 nm, possibly due to absorption by cytochrome c at this wavelength.
