![]() Figure 11 of
Cameron, Mol Vis 2005;
11:775-791.
Figure 11 of
Cameron, Mol Vis 2005;
11:775-791.
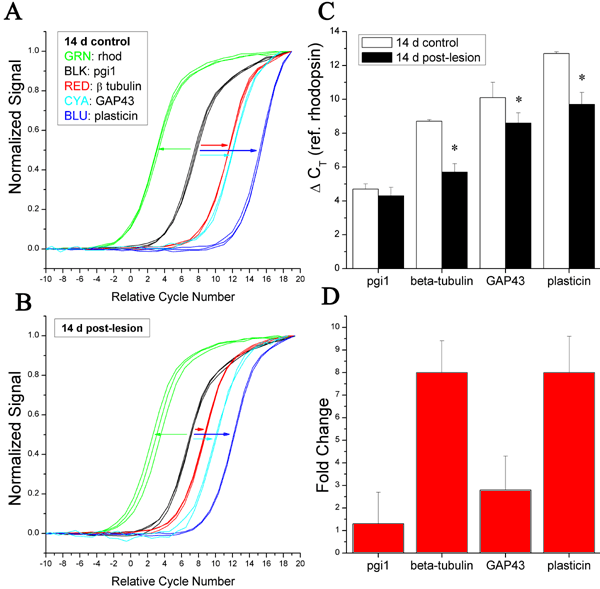
Figure 11. qPCR analysis: 14 d post-lesion retina
Normalized growth curves of single, sequence-confirmed PCR-amplified products are shown for control (A) and 14 d post-lesion retina (B), as in Figure 9. The amplified products are partial-length sequences (Table 1) encoding rhodopsin (green), pgi1 (black), GAP43 (cyan), γ-tubulin (red), and plasticin (blue); this color scheme matches that of Figure 6. As in Figure 9, the lengths of the colored arrows illustrate approximate differences between the respective CT values, and indicate lesion-induced increases (leftward shifts in the growth curves) in the expression of GAP43, γ-tubulin, and plasticin, but not pgi1. C: Measured differences in CT relative to rhodopsin (CT; error bars represent standard deviation). Asterisks indicate statistically significant differences between the control and post-lesion conditions (p<0.05, Student's t-test). D: Inferred linear fold-enhancement of gene expression, determined from the data of panel C. Error bars represent standard deviation.
