![]() Figure 5 of
Rogojina, Mol Vis 2003;
9:482-496.
Figure 5 of
Rogojina, Mol Vis 2003;
9:482-496.
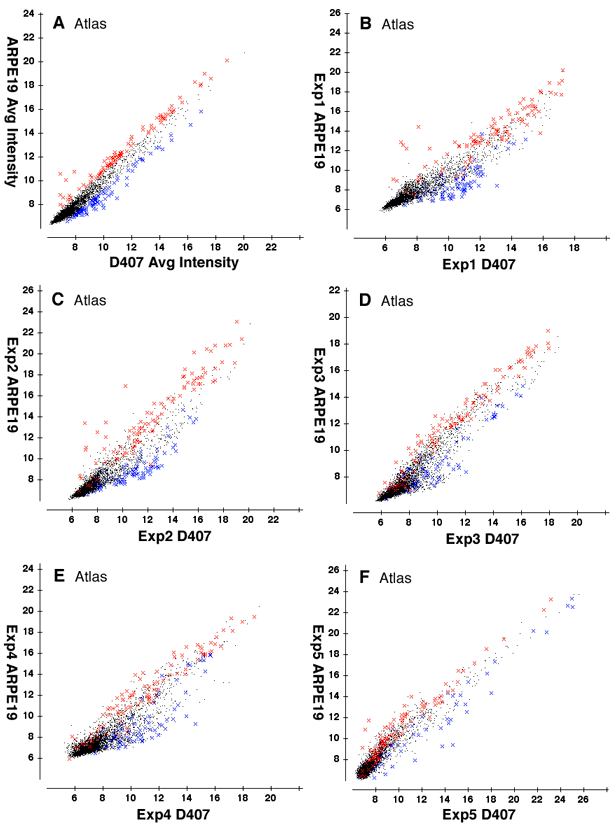
Figure 5. Significant differences on the Atlas Glass microarrays
The data presented in this figure is similar to that presented in Figure 2, a comparison between the D407 cell line and the ARPE19 cell line as defined by the Atlas Glass Human 3.8 array. Panel A is the average of all five individual experiments (B-F). The averaged data was used to identify genes that were 1.7 fold up-regulated (red) and 1.7 fold down-regulated (blue). In general, there is a similar distribution of up-regulated and down-regulated genes across experiments. These data again reveal the internal consistency of the Atlas Glass Human 3.8 platform. The data is scaled as in Figure 1.
