![]() Figure 2 of
Rogojina, Mol Vis 2003;
9:482-496.
Figure 2 of
Rogojina, Mol Vis 2003;
9:482-496.
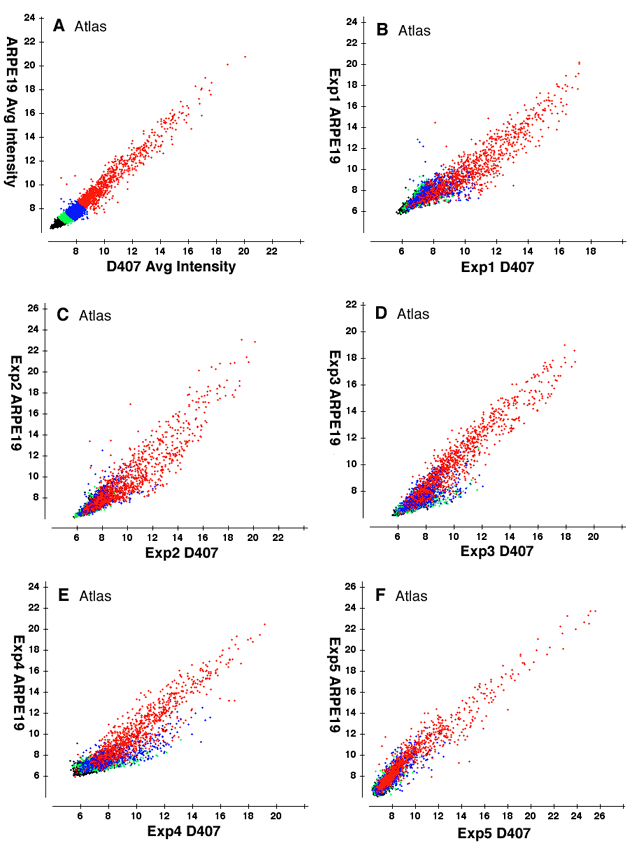
Figure 2. Comparison of D407 to ARPE19 cells using Atlas Glass microarrays
The comparison between the D407 cell line and the ARPE19 cell line using the Atlas Glass Human 3.8 platform is shown. Panel A is the average of all five individual experiments (B, C, D, E, and F). The averaged data was divided into quartiles and colored, allowing for a visual comparison to the individual experiments. In general, there is a similar distribution of intensities across experiments with the most intensively labeled probes being heavily labeled on all experiments. These data reveal the internal consistency of the Atlas Glass Human 3.8 platform. The data is scaled as in Figure 1.