![]() Figure 1 of
Rogojina, Mol Vis 2003;
9:482-496.
Figure 1 of
Rogojina, Mol Vis 2003;
9:482-496.
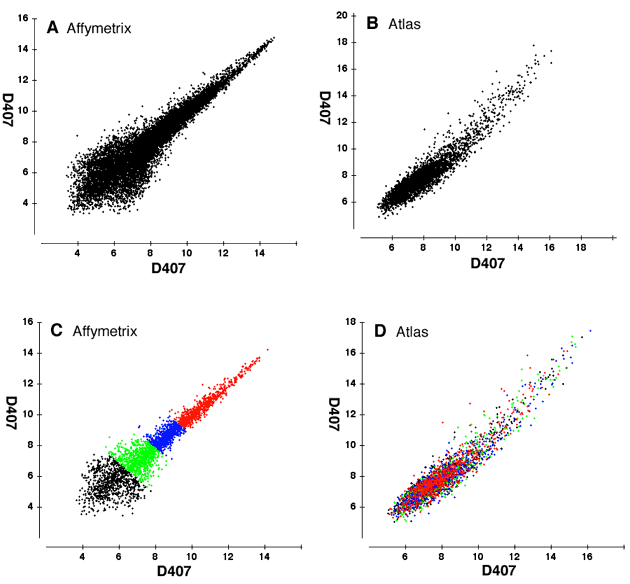
Figure 1. Internal consistency in the Affymetrix and Atlas Glass microarrays
The results from the control experiments using only RNA from the D407 cell line are illustrated in four scatter plots. To compare the data between the two microarray platforms the data was scaled using the formula 2(z-score of log2[intensity+1])+8. This set the mean intensity of each experiment to 8 and the standard deviation to 2. The results from a single Affymetrix HG-U95Av2 experiment are shown in A. Affymetrix chips hybridized with D407 targets reveal a good correlation between these two samples (Pearson correlation coefficient 0.924). For the data of the Atlas Glass Human 3.8 slide, an average of two separate experiments is shown in B. Notice that, on average, there is a good correlation between the genes on the two channels (Pearson correlation coefficient 0.937) with the majority of genes clustering around a line running through an intensity ratio of 1. To make a direct comparison between the two platforms, the data was filtered to include only genes in common with both platforms (C and D). The data on the Affymetrix platform was then divided into quartiles and colored. Notice the disconcordance between signal intensities on the Affymetrix platform as compared to those observed on the Atlas Glass platform (D). For example, genes having very high signal intensity on the Affymetrix chip (upper quartile colored red) are spread throughout the distribution on the Atlas Glass platform. Some of the genes even have very low signal intensity on the Atlas platform.
