![]() Figure 4 of
Yu, Mol Vis 2001;
7:48-56.
Figure 4 of
Yu, Mol Vis 2001;
7:48-56.
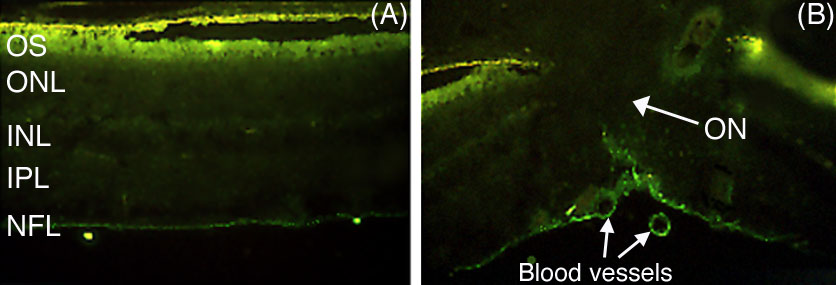
Figure 4. Epifluorescence micrographs of different regions of retinal sections from two eyes 1 h after intravitreal injection of fl-actin
A: Most of the fl-actin is seen in the NFL, with little fluorescence detectable in other retinal layers. The bright signal in the OS is attributed to autofluorescence, as explained in Figure 1A and Figure 3A. B: Cells comprising the walls of blood vessels near the intraretinal portion of the optic nerve were found to take up fl-actin in a manner similar to that seen for fl-Hsc/Hsp70 injected eyes (compare to Figure 3B). 50x magnification. n=9.