![]() Figure 4 of
Gilliland, Mol Vis 2001;
7:120-130.
Figure 4 of
Gilliland, Mol Vis 2001;
7:120-130.
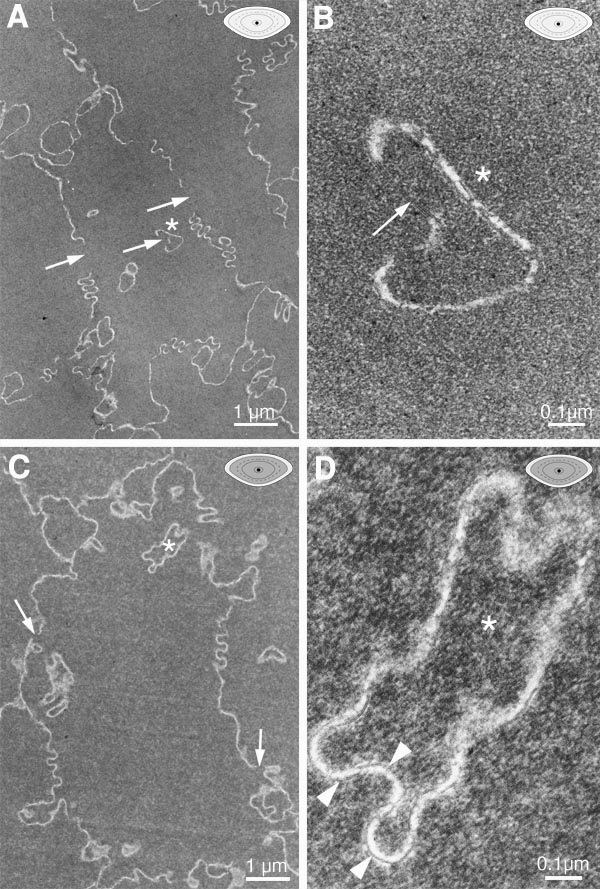
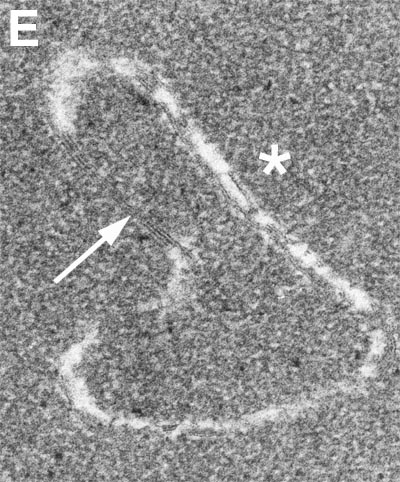
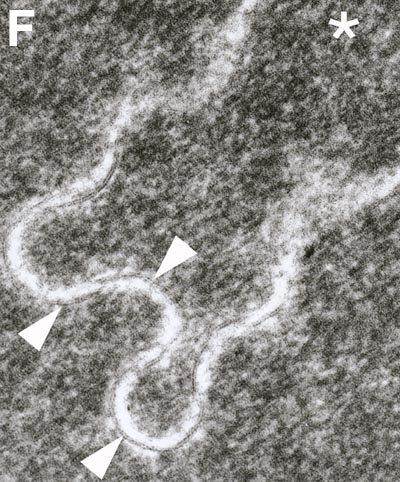
Figure 4. Electron micrographs of normal and cataractous lenses
A 50 year old normal transparent lens (A, B) and an 81 year old age-related nuclear cataract (C, D) are compared using transmission electron microscopy. Electron micrographs at low magnification (A, C) are consistent with light micrographs in Figure 2. High magnification images (B, D) of circular profiles (*) in the cytoplasm confirm that they are bounded by paired membranes including a gap junction (arrows), implying that they are derived from projections of the cellular interface rather than isolated vesicles. Square array junctions containing MIP/Aquaporin0 channels are marked by arrowheads (D). E and F are further magnifications of the area of interest near the "*" from B and D. In the upper right corner of images A-D is a lens locator diagram (light gray for a normal lens and dark gray for a cataract) which contains a black dot to indicate which developmental region of the lens (see Figure 1B) is shown in the micrograph.