![]() Figure 2 of
Gilliland, Mol Vis 2001;
7:120-130.
Figure 2 of
Gilliland, Mol Vis 2001;
7:120-130.
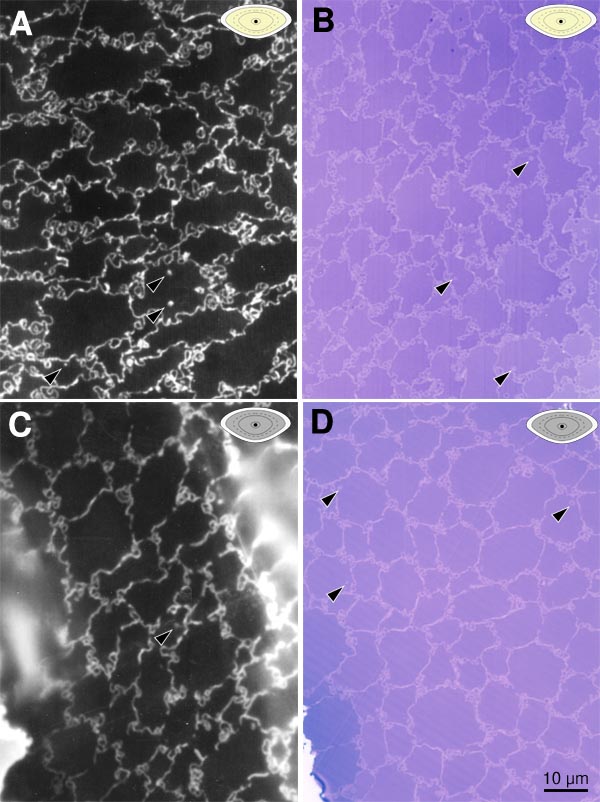
Figure 2. Microscopic images of embryonic fiber cells
A 50 year old normal transparent lens (A, B) and an 81 year old age-related nuclear cataract (C, D) are compared using two microscopic techniques. Lipid-containing membranes and circular profiles are visualized in a fluorescence microscope using the lipophilic stain, DiI (A, C), whereas similar fields of the same lenses are seen in histological sections stained with TBO (B, D). Many circular profiles are visible at the intercellular interfaces especially where three cells join. Only a few lipid-containing profiles are visible in the cytoplasm (arrowheads). The quantitative analysis shows that the normal lens has more profiles than the cataract, and most of the profiles are near intercellular interfaces. In the upper right corner of each image is a lens locator diagram (yellow for a normal lens and gray for a cataract) which contains a black dot to indicate which developmental region of the lens (see Figure 1B) is shown in the micrograph.