![]() Figure 8 of
Lyubarsky, Mol Vis 2001;
7:71-78.
Figure 8 of
Lyubarsky, Mol Vis 2001;
7:71-78.
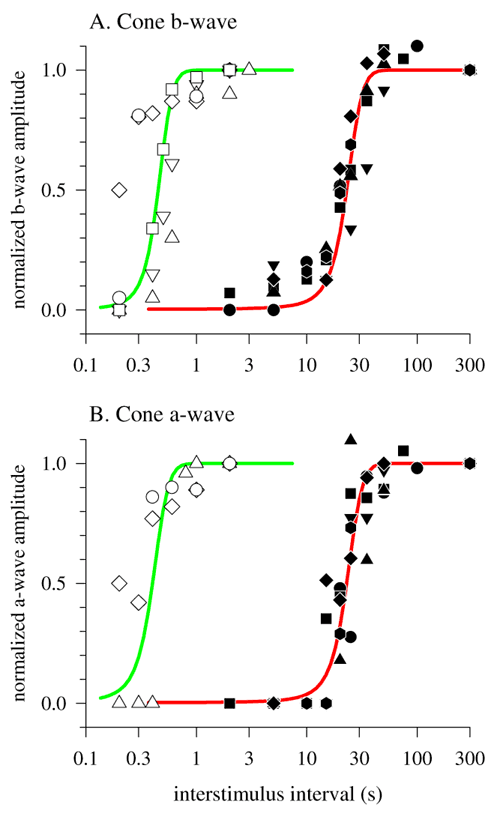
Figure 8. Time course of recovery of cone b-wave and cone a-wave from a strong conditioning flash
A: Normalized amplitudes of cone-driven b-waves for WT (open symbols, n=5), and RGS9-1 -/- mice (filled symbols, n=6) plotted as function of the interstimulus interval (ISI) between the conditioning and probe flashes. B: Normalized amplitudes of cone a-waves plotted as a function of the ISI for 3 WT and 5 RGS9-1 -/- mice. The same symbols are used in panels A and B for the data of the same animal. The normalization in each panel was based on the amplitude of the responses at an ISI of 2 or 3 s for WT, and at an ISI of 300 s for RGS9-1 -/- mice. All data in the two panels were collected with the experimental protocols illustrated in Figure 6 and Figure 7. The colored curves have the formula amplitude(t)=1/(1+exp(-(t-t1/2)/t)), so that t1/2 is the time of 50% recovery, and t1/2 ± 2.3t is approximately the time from 10% to 90% recovery. This same function has been used to describe the recovery of human ERG a-waves [30]. In panel A, the parameter values for WT (green curve) are t1/2=0.45 s and t=0.07 s. The parameter values for RGS9-1-/- (red curve) are t1/2=4.0 s and t=23 s. The parameter values used for the curves in panel B are the same, except t1/2=0.40 s for WT. (Accurate estimation of the a-wave recovery in WT mice is difficult at times earlier than 0.3 s, because oscillatory potentials triggered by the initial, conditioning flash can have comparable magnitude to the cone a-wave; see Figure 6 "Control" response.)