![]() Figure 4 of
Hamer, Mol Vis 2000;
6:265-286.
Figure 4 of
Hamer, Mol Vis 2000;
6:265-286.
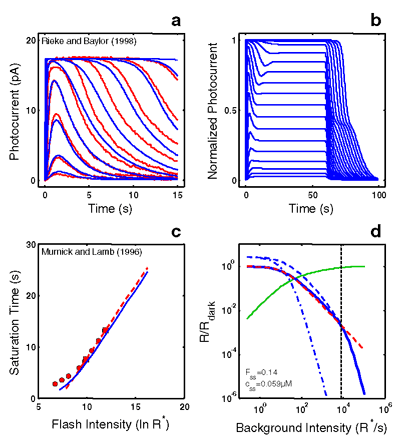
Figure 4. RecRK model accounts for Empirical Response Suite I with τE rate-limiting
A: The RecRK model (with τE rate-limiting) was optimized to both the Murnick & Lamb saturated two-flash data and to four sub-saturating flash responses from toad rods (four smallest responses). The model is able to provide a reasonable account of the 4 sub-saturating responses as well as responses to 5 higher intensities (to which the model was not optimized). B: Model step responses reproduce the "nose" at step onset and the two-phase response at step offset. C: The model Tsat versus ln(I) function (blue solid curve) reproduces the same slope as the Murnick & Lamb data (~2.8 s/ln unit; red data and dashed line as in Figure 1B).
Finally, the model generates a substantial range of Weber's law LA flash sensitivity (~3 log units; solid blue curve, panel D). For each of a series of background adaptation levels (Ib), model LA flash sensitivity was defined as the amplitude of the response to a flash of fixed criterion intensity divided by the intensity of the criterion flash. The criterion was the flash intensity eliciting a DA flash response amplitude that was 10% of the full range of circulating current. The dashed red curve is the Weber-Fechner relation from Figure 1D, shifted horizontally to fit the model output below a "cutoff" background intensity (cutoff Ib), marked by a dotted vertical cursor, above which the model was judged to deviate from Weber's law.
The cutoff Ib was defined as the highest Ib at which the value of the model deviated from the best-fit Weber-Fechner curve by a criterion amount (0.05 log units). The Weber-Fechner curve was fit (least-squares) to the model over all Ib values up to and including the highest Ib where the model slope was still >=-1. The model slope was estimated by fitting a line to a moving window of 3 adjacent model points (sampling every 20.25 R*/s, or 0.075 log units).
Note that the model LA flash sensitivity obeys Weber's law over a significant range (cutoff Ib = 8000 R* s-1). At the cutoff Ib, 14% of the model DA circulating current (Fss) remains, as indicated by the intersection of the vertical cursor line with the green solid curve. The latter plots the fraction that the steady-state current is saturated (i.e., 1 - Fss(Ib)), where Fss is the steady-state circulating current defined to be 1.0 in the dark, and zero when all channels are closed. Also, at the cutoff Ib, the steady-state internal Ca++ level (css in inset) has dropped by a factor of 5.1, from a dark value of 0.3 μM to 0.059 μM.
Also shown is the LA flash sensitivity of the model under two types of simulated Ca++ clamp conditions: (1) LA flash sensitivity with Ca++ clamped at its dark value (Ca++dark clamp; blue dash-dot curve). Ca++ feedback is fully disabled over the entire dynamic range, with only static saturation contributing to flash desensitization. Ca++ was fixed at its dark value in the model, and Ib was adjusted to achieve the same steady-state current as in the unclamped case, ensuring that the steady-state currents were at the same level in relation to static saturation (i.e., cGMP-gated channel). Differences in flash sensitivity then can be ascribed to the differing states of Ca++ in the unclamped and clamped cases.
The Ca++dark clamp analysis equates steady-state current levels (Fss), but does not equate internal Ca++ levels at the time of presentation of the flash. This is achieved in a second analysis: (2) LA flash sensitivity with Ca++ clamped at the new steady-state level reached in response to each Ib (Cass++ clamp; blue dashed curve). This approach equates the Fss (and hence equates the effect of channel saturation), and equates Ca++ at the time of the flash. Thus, in comparing the unclamped and the Cass++-clamped flash sensitivity, the LA flash response in each case is affected equally by saturation and by the steady-state level of Ca++-mediated gain. The only additional factor shaping the LA flash response in the unclamped case is the dynamic Ca++-mediated gain change evoked by the flash.
Note that at high Ib (Ib> cutoff Ib), the unclamped model flash sensitivity falls more steeply than a Weber's law slope of -1, and eventually follows a steep function that parallels the high - Ib behavior of both Ca++ clamped curves. In fact, all 3 curves asymptote to a slope of -(ncg + 1), which is predicted by the instantaneous compressive saturation of the cGMP-gated channels [30].