![]() Figure 1 of
Hamer, Mol Vis 2000;
6:265-286.
Figure 1 of
Hamer, Mol Vis 2000;
6:265-286.
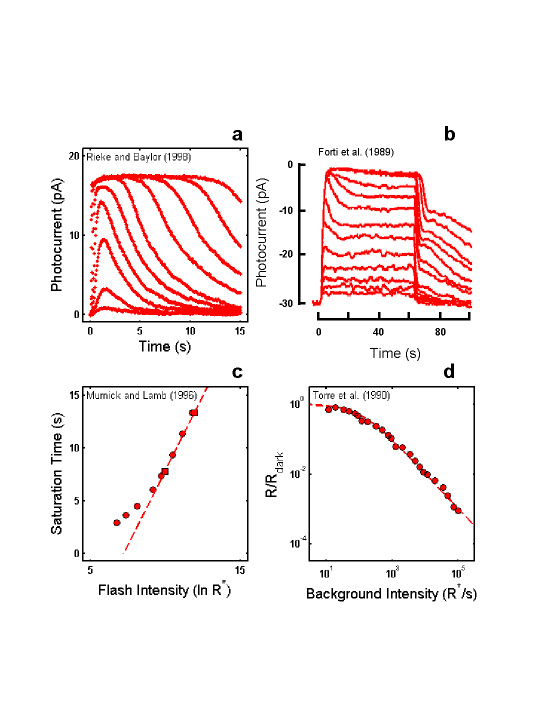
Figure 1. Empirical Response Suite I
A: Sub-saturated flash responses obtained from toad rods obtained by Rieke & Baylor [16]. Each model was simultaneously optimized to a subset of these data and to the Murnick & Lamb saturated data (shown in Figure 3). The sub-saturating responses used for optimization were the responses to the lowest four intensities: 0.10, 0.35, 1.29, and 4.35 photons/m2/10 ms flash, or 2.26, 7.91, 29.15, and 98.3 R*/10 ms flash assuming an effective collecting area of 22.6 m2.
B: Step responses obtained from newt rods by Forti et al. [17]. These data have two qualitative, signature features that have been observed in step responses from rods of other species (e.g., salamander [22]; primate [18]). (1) A "nose" on the leading edge of the response that recovers slowly to a steady-state level. (2) A pronounced, multi-phasic response at step-offset, exhibiting a fast recovery phase followed by a slow phase, with some damped resonant behavior in between.
C: A summary of the intensity-dependence of saturation period (Tsat) observed by Murnick & Lamb. The signature feature is the slope of the Tsat versus ln(I) function. The thick red dashed line has a slope of 2.8 s/ln unit, the slope for the cell presented in Figure 3 of Murnick & Lamb. The cell presented in their Figure 3 (whose data are analyzed in this paper) only provided two data points on the Tsat function (filled red squares). However, the Tsat slope for this cell closely matches data from another rod presented in their Figure 1 (filled red circles), and is close to the average of the Tsat slopes of seven cells presented in their Table 1 (2.7 s/ln unit).
D: The decrease in flash sensitivity as a function of background light intensity (LA flash sensitivity). The data (filled red circles) are from 6 newt rods studied by Torre et al. [23]. The dashed red curve is the Weber-Fechner relation fit to the Torre et al. data: i.e., R/Rdark = (1 + I/I1/2)-1. The intensity that caused the incremental flash sensitivity to decrease by a factor of 2 (I1/2) was 100R*s-1. The signature feature of note is the relatively large dynamic range over which flash sensitivity obeys the Weber-Fechner relation. In this case, the Torre et al. [23] data obeys the Weber-Fechner relation over a ~4 log unit intensity range.
