![]() Figure 3 of
Hamer, Mol Vis 2000;
6:265-286.
Figure 3 of
Hamer, Mol Vis 2000;
6:265-286.
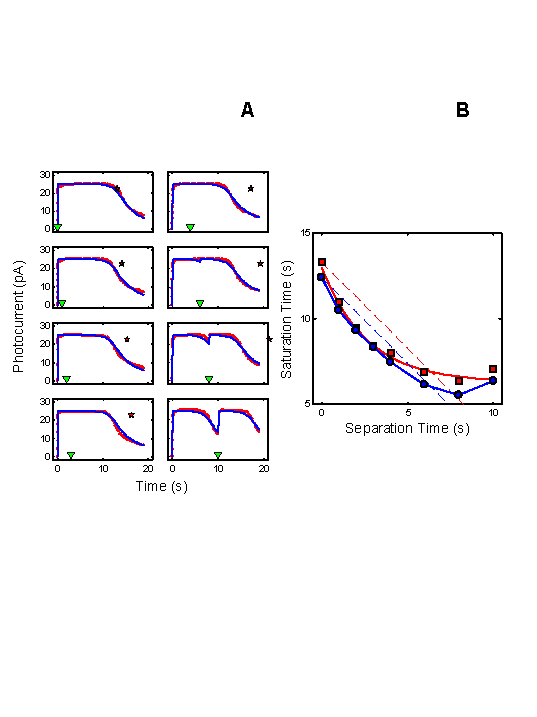
Figure 3. RecRK model accounts for Murnick & Lamb data with τE rate-limiting
A: Murnick & Lamb saturated two-flash data (red) with the model fits (blue) for delays of 0, 1, 2, 3 s (left column of panels), and 4, 6, 8, and 10 s (right column of panels), where delay equals time between saturating Pre-flash and a more intense saturating Test flash. The parameters for the model are given in Table 2.
In each panel, the time at which the Test flash was presented is indicated by an inverted green triangle near the abscissa. The red star near the top of each panel marks the time at which the response to the Test flash would have emerged from saturation if the Pre-flash had had no effect. Note that the data remain in saturation for progressively less time as delay increases (the time between the saturated data and the red star increases as delay increases). The model fits the Murnick & Lamb data quite well.
B: Plot of Test flash Tsat versus delay for both the data and model (derived from A). Tsat was defined as the time between application of the Test flash and the time at which the response first recovered from saturation, i.e., fell to less than 90% saturation. The model responses are shown as blue filled circles and the solid blue curve, and the Murnick & Lamb data are shown as red filled squares with a red solid curve. The dashed lines have a slope of -1, and are placed to pass through the first data point (at delay = 0) for both the model results and the data. The data fall below this line out to a delay of 6-7 s, illustrating the signature feature that the change in Tsat can exceed the delay. The model results capture this feature, and also fall below the corresponding blue line of slope -1.