![]() Table 2 of
Hamer, Mol Vis 2000;
6:265-286.
Table 2 of
Hamer, Mol Vis 2000;
6:265-286.
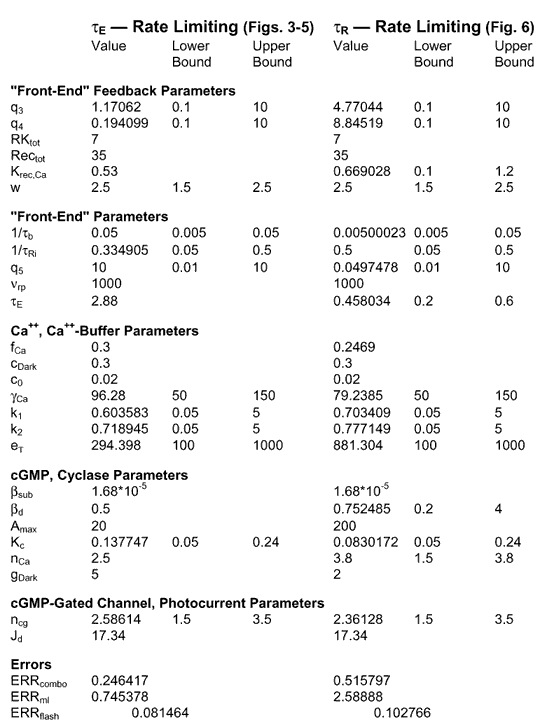
Table 2. Parameters for Analysis of RecRK Model
 |
Parameters are grouped according to functional elements of the model. All descriptions of parameters are given in Table 1. For each of the two rate-limiting cases analyzed (τE, τR), the columns of numbers show the optimized parameter value, and the lower and upper bounds used in the optimization. The latter are shown only for parameters that were actually optimized. The errors listed at the bottom of the Table are RMS errors for the fits to the Murnick & Lamb [2] saturated two-flash data (ERRM&L; data from their Figure 3) and to the sub-saturated flash responses from Rieke & Baylor [16] (ERRflash; responses to the 4 lowest flash intensities shown in their Figure 4). The combined error (ERRcombo) was calculated as the square root of the product of the two other errors.