![]() Figure 16 of
Hamer, Mol Vis 2000;
6:265-286.
Figure 16 of
Hamer, Mol Vis 2000;
6:265-286.
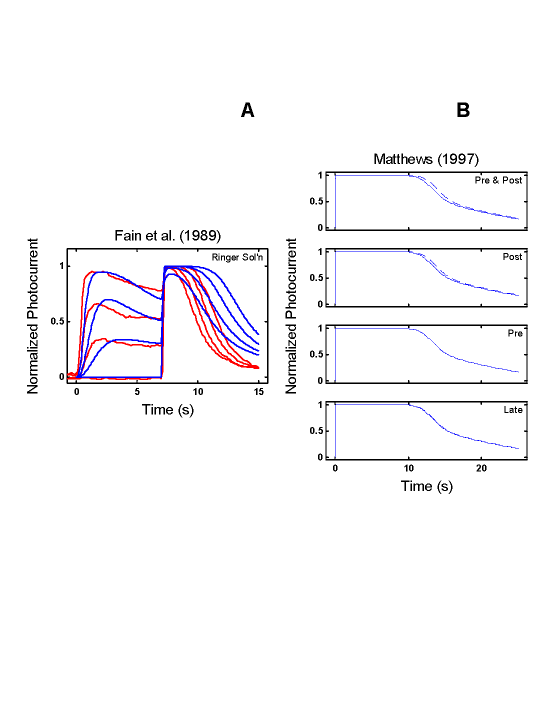
Figure 16. A combined model with τR rate-limiting accounts for Empirical Response Suite II
With τR rate-limiting and R* activation the dominant of the two front-end gains, using the same parameters as in Figure 14, the combined (R*-activation-RecRK) model reproduces the signature qualitative features of the step-flash paradigm of Fain et al. [27] (A). As in the Fain et al. data (red), the period of saturation of the model to a saturating flash (blue curves) decreases progressively as the intensity of a prior conditioning step of light in increased. (B) With the same parameters, the model also reproduces Matthews' extension of saturation period when a Ca++ clamp is applied near the time of the flash ("Pre & Post" and "Post" conditions; dashed blue curve), but not when it is applied too early ("Pre") or too late ("Late") (compare with Figure 2B).
