![]() Figure 2 of
Hamer, Mol Vis 2000;
6:265-286.
Figure 2 of
Hamer, Mol Vis 2000;
6:265-286.
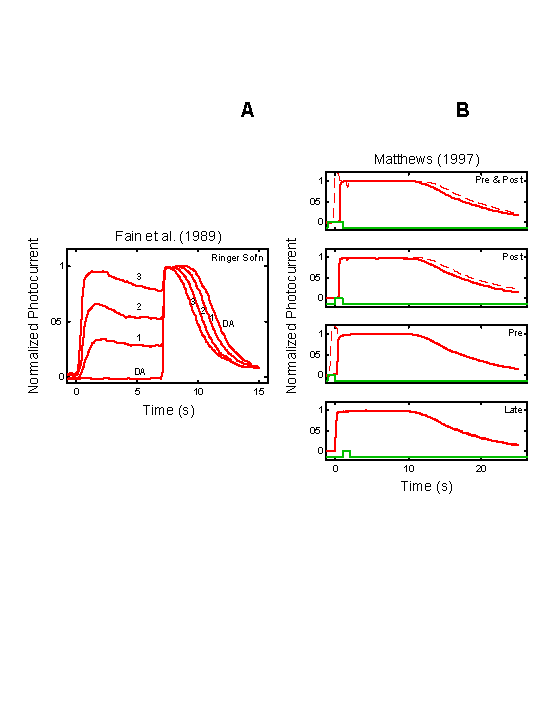
Figure 2. Empirical Response Suite II
A: Results of the Fain et al. [27] step-flash paradigm. A saturating flash was applied after presentation of a 7 s conditioning step of light of increasing intensity (curves labeled 1, 2, and 3). The flash response in the absence of a conditioning step is shown by the curve labeled DA. The signature feature to note is that the period of saturation in response to the flash decreases as the intensity of the conditioning step increases.
B: Results of a "Ca++ clamp" experiment by Matthews [2]. Tiger salamander rods were exposed to a 0 Ca++/0 Na+ test solution for brief periods around the time of presentation of a super-saturating, 20 ms flash. Removal of external Ca++ minimizes the influx of Ca++ through the outer segment cation channels, while removal of external Na+ prevents Ca++-efflux through the Na+: Ca++, K+ exchanger [22,27-29].
The Ca++ clamp was applied at one of four time periods: from 1 s before, to 1 s after the flash ("Pre & Post" condition); from the time of the flash until 1 s after the flash ("Post" condition); from 1 s before the flash until the time of the flash ("Pre" condition), or from 1 s after the flash until 2 s after the flash ("Late" condition; green trace above abscissa in each panel). The signature qualitative feature to note is that in the "Pre & Post" and "Post" conditions (but not in the "Pre" and "Late" conditions), the period of photocurrent saturation is significantly prolonged under Ca++ clamp (right-most curves in each case).
