![]() Figure 13 of
Hamer, Mol Vis 2000;
6:265-286.
Figure 13 of
Hamer, Mol Vis 2000;
6:265-286.
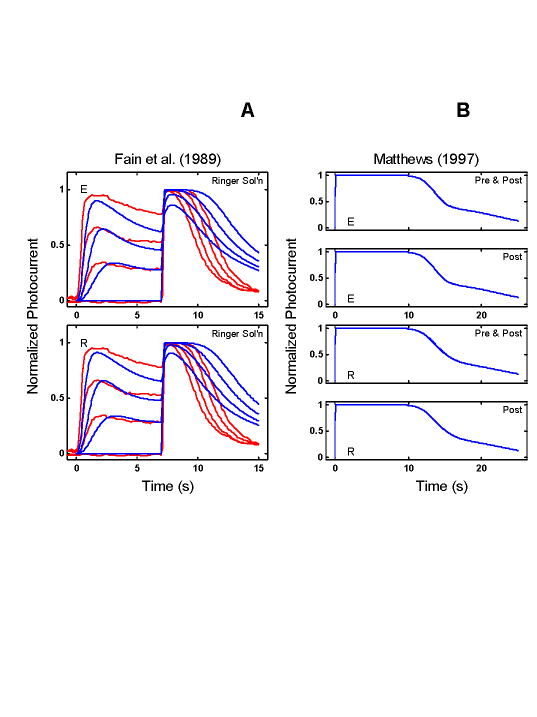
Figure 13. An R* activation model can be ruled out
A: The R* activation model readily reproduces the qualitative features of the Fain et al. [27] step-flash data regardless of whether τE (top panel) or τR (bottom panel) is rate-limiting. B: However, for neither of the rate-limiting cases (τE: top two panels; τR: bottom two panels) can the model capture the key feature of the Matthews [3] data, i.e., when a Ca++ clamp is applied for a brief period around the time of the flash, the model does not generate any significant extension of saturation period (compare with data, Figure 2B). This failure implies that the R* activation model, and any similar model (with an early Ca++ feedback up to and including PDE activation) that does not alter the recovery kinetics of the target reaction, can be ruled out.
