![]() Figure 3 of
Hobby, Mol Vis 2000;
6:72-78.
Figure 3 of
Hobby, Mol Vis 2000;
6:72-78.
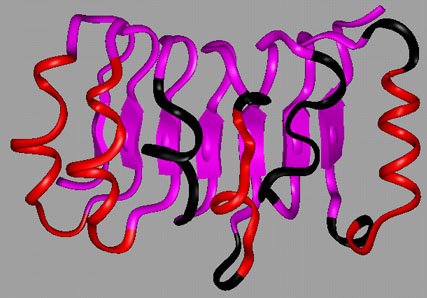
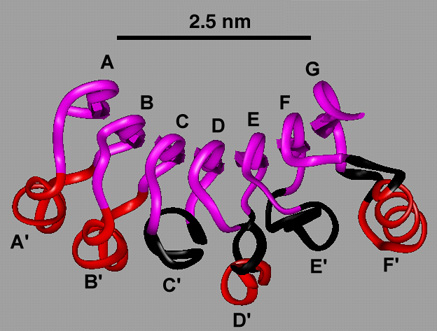
Figure 3. Ribbon diagrams of the Optc model
A. View of the OPTC model parallel to the direction of the LRR bstrands. B. View of the Optc model rotated by 90°. In (A) it can be seen that the short 9 and 10 residue outer strands (C' and E') make two substantial grooves in the outer surface of the molecule. The color coding follows that of Figure 2.
A.
B.