![]() Figure 5 of
Kuszak, Mol Vis 1999;
5:7.
Figure 5 of
Kuszak, Mol Vis 1999;
5:7.
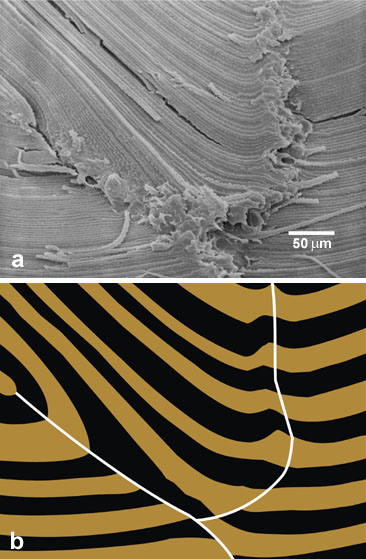
Figure 5. Creation of texture maps from tracings of scanning electron micrographs
(A) Higher magnification of scanning electron micrograph in Figure 4B. By tracing fiber groups from the equator to their sutural terminations (B) scale computer generated texture maps are made of representative growth shells. In this manner, lens suture patterns are analyzed as a function of age, and during posterior subcapsular cataract internalization as seen in Figure 6, Figure 7, Figure 8, and Figure 9.