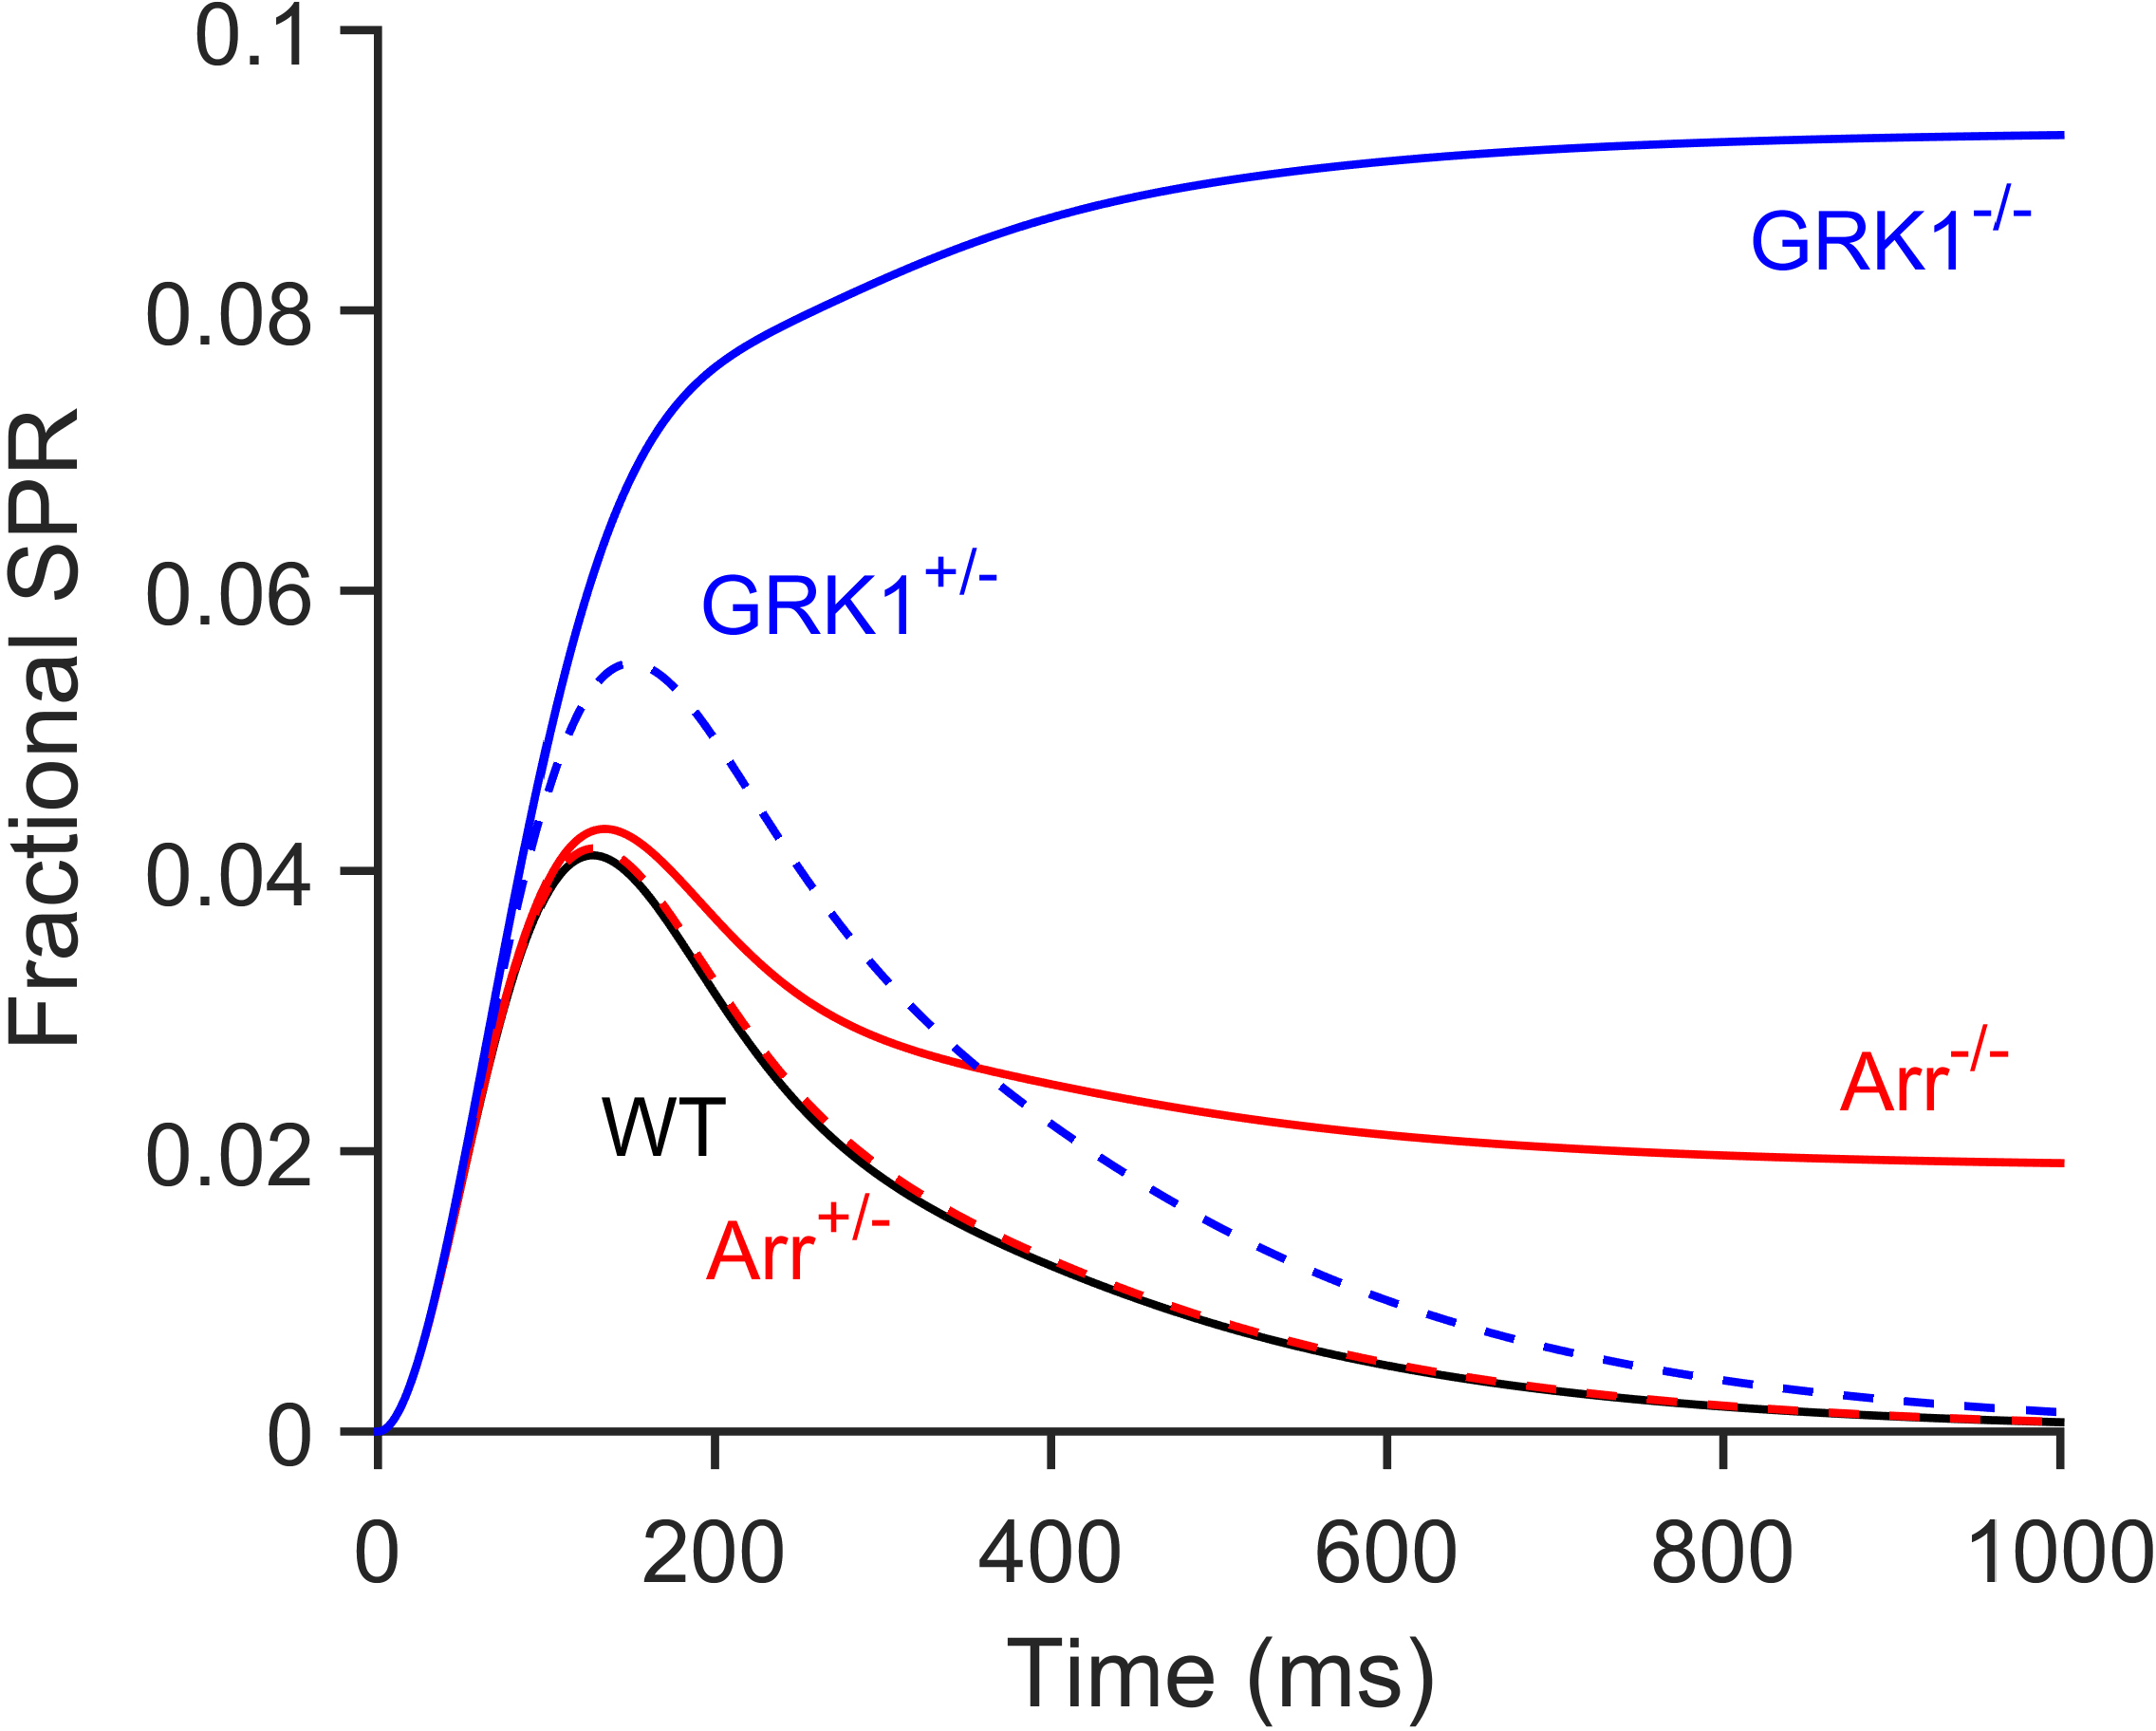
Figure 6. Simulation of SPRs for mutant phenotypes using the three-state model. Simulated mean SPRs predicted by the three-state model
are shown. The wild-type (WT) response is the same as in
Figure 4E and was averaged from 10
5 simulations. The remaining traces were each averaged from 10
4 simulations. The hemizygote responses (dashed traces) for Arr
+/− (red) and GRK1
+/− (blue) were obtained by halving the respective rate parameter, μ or ν, from the value shown in
Table 1. The knockout responses (solid traces) for Arr
−/− (red) and GRK1
−/− (blue) were obtained by reducing the respective rate parameter, μ or ν, to zero.
 Figure 6 of
Lamb, Mol Vis 2016; 22:674-696.
Figure 6 of
Lamb, Mol Vis 2016; 22:674-696.