Figure 9. Comparison of treated versus control eye gene expression differences in
Figure 5. Panel
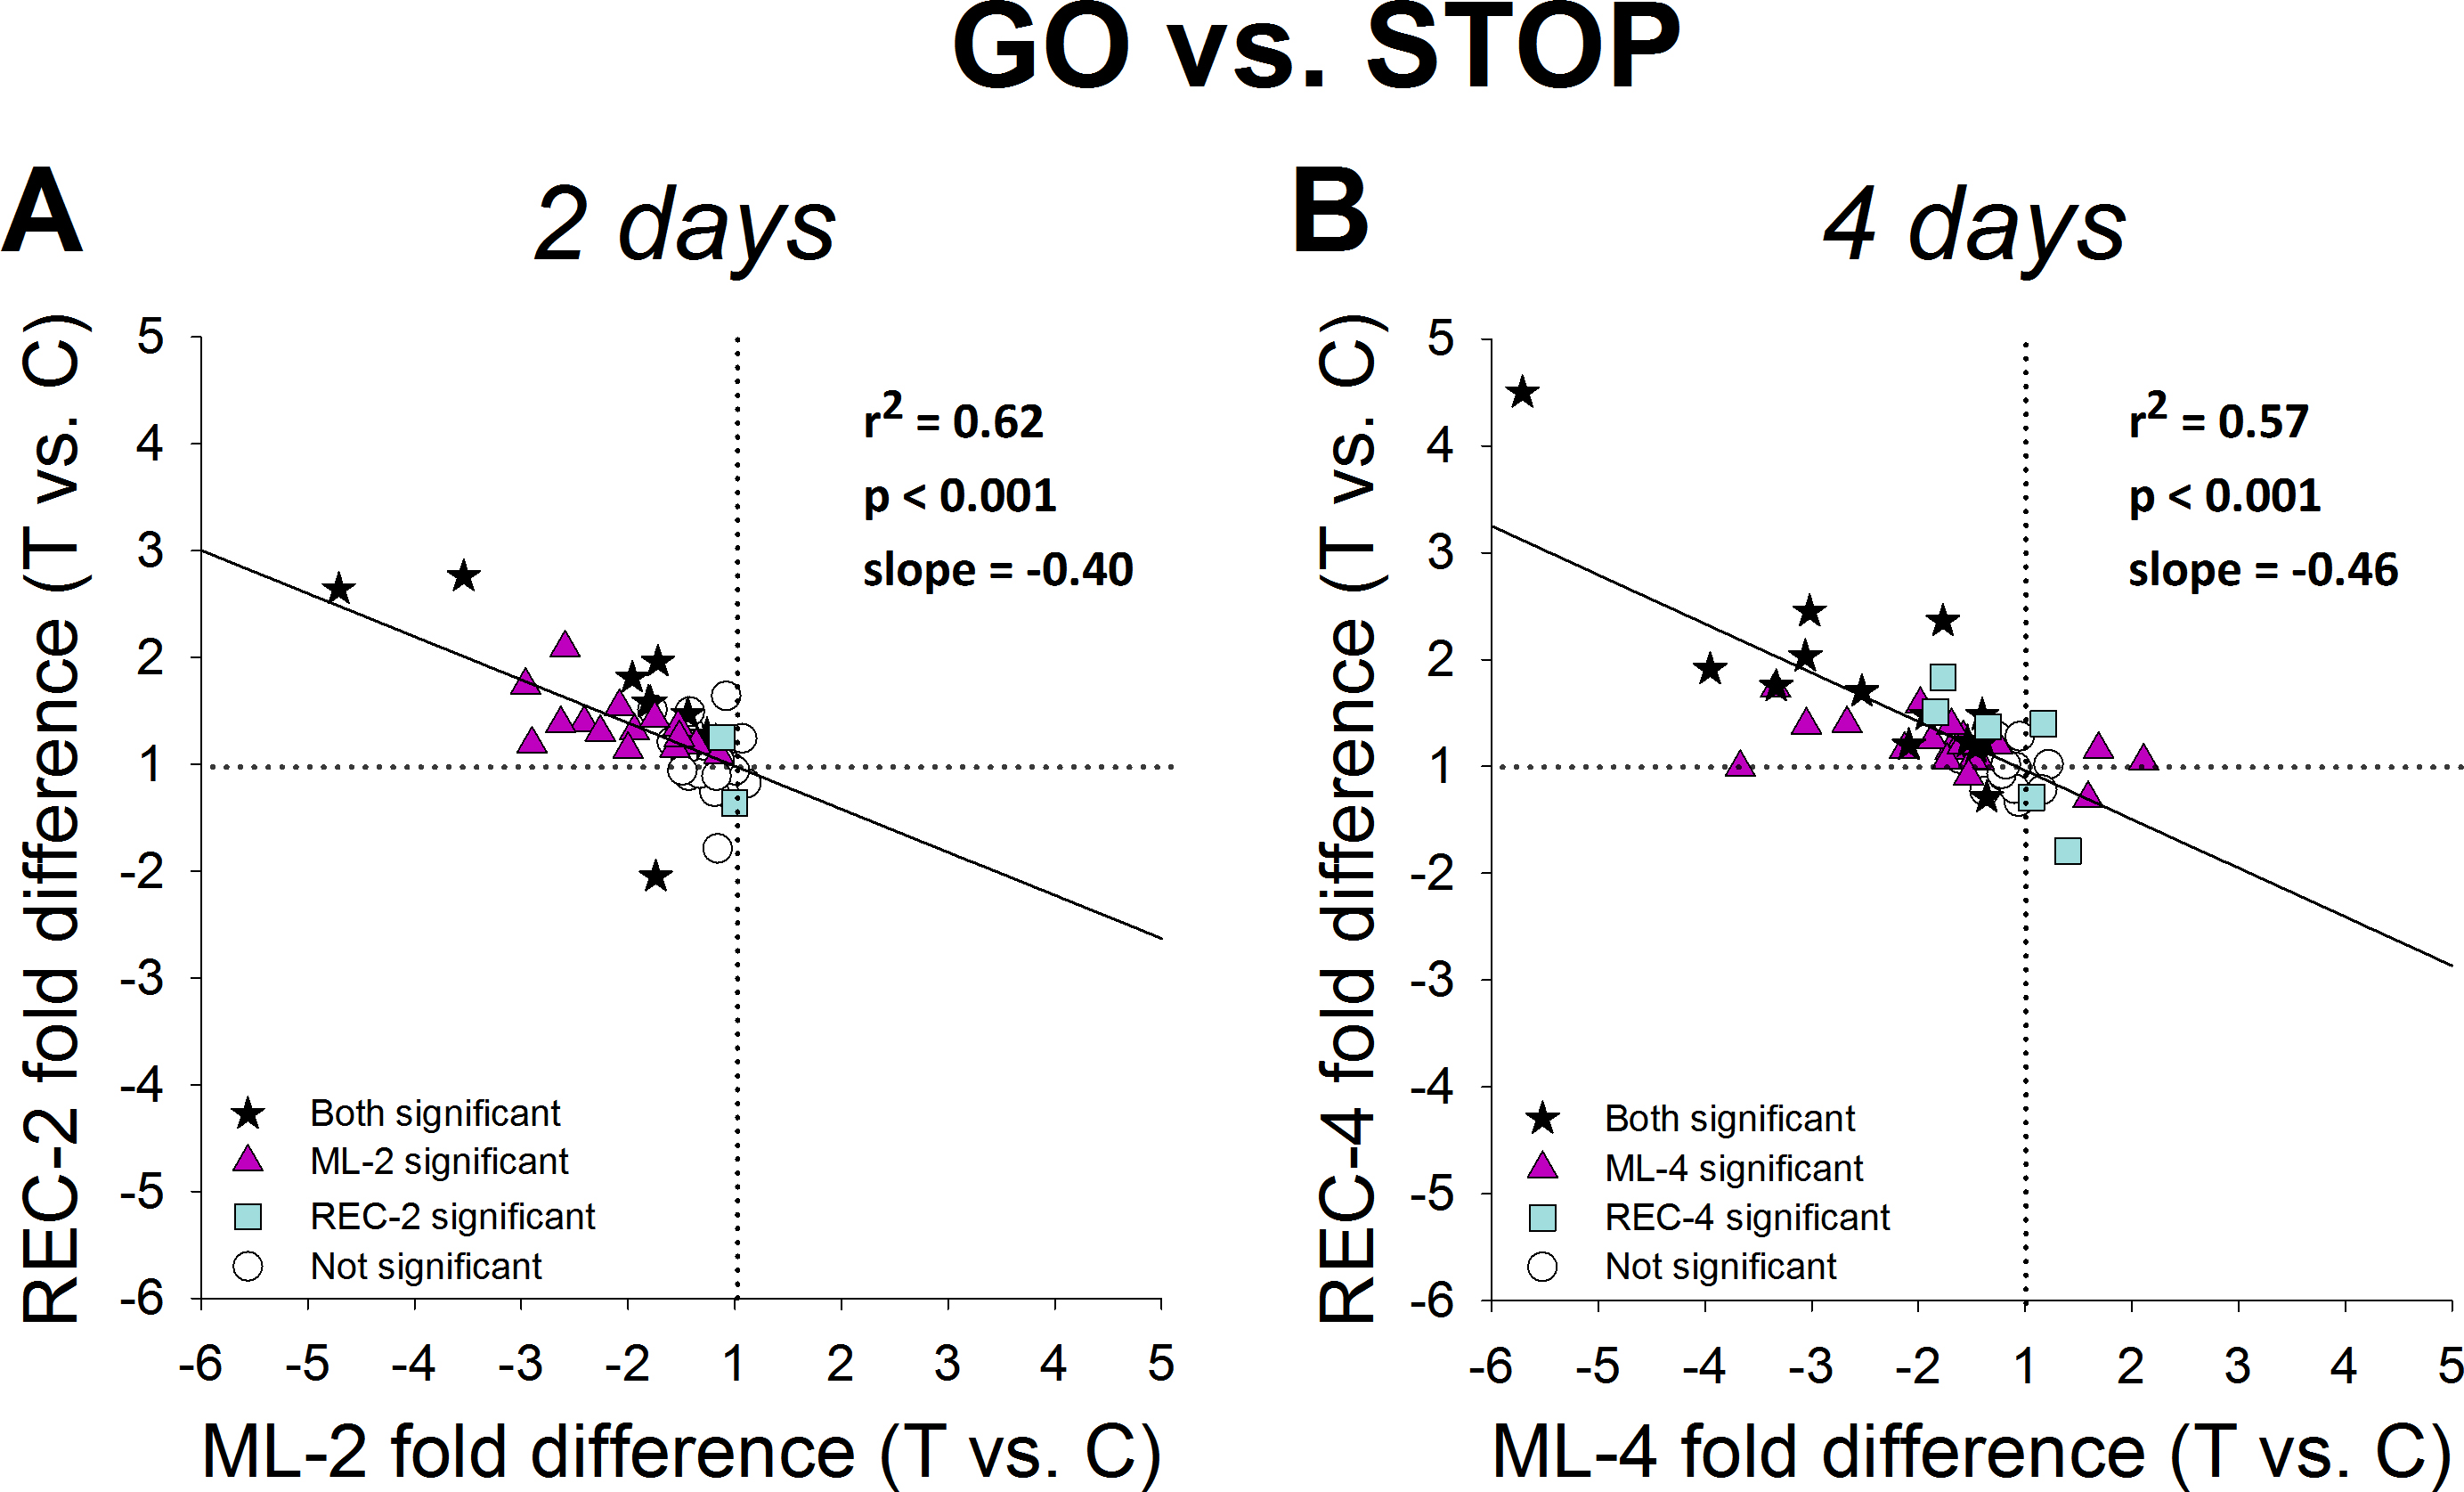
A compares the REC-2 pattern (
Figure 5D) with the ML-2 pattern (
Figure 5A); panel
B compares the REC-4 pattern (
Figure 5E) with the ML-4 pattern (
Figure 5B). As expected from
Figure 5, the GO and STOP patterns differed from each other and differed in a similar way at both time points. Stars represent significant
fold differences for both treatments; triangles represent significant fold differences only for ML; squares represent significant
fold differences only for REC, represent fold differences not significant for either treatment.
 Figure 9 of
Guo, Mol Vis 2014; 20:1643-1659.
Figure 9 of
Guo, Mol Vis 2014; 20:1643-1659.