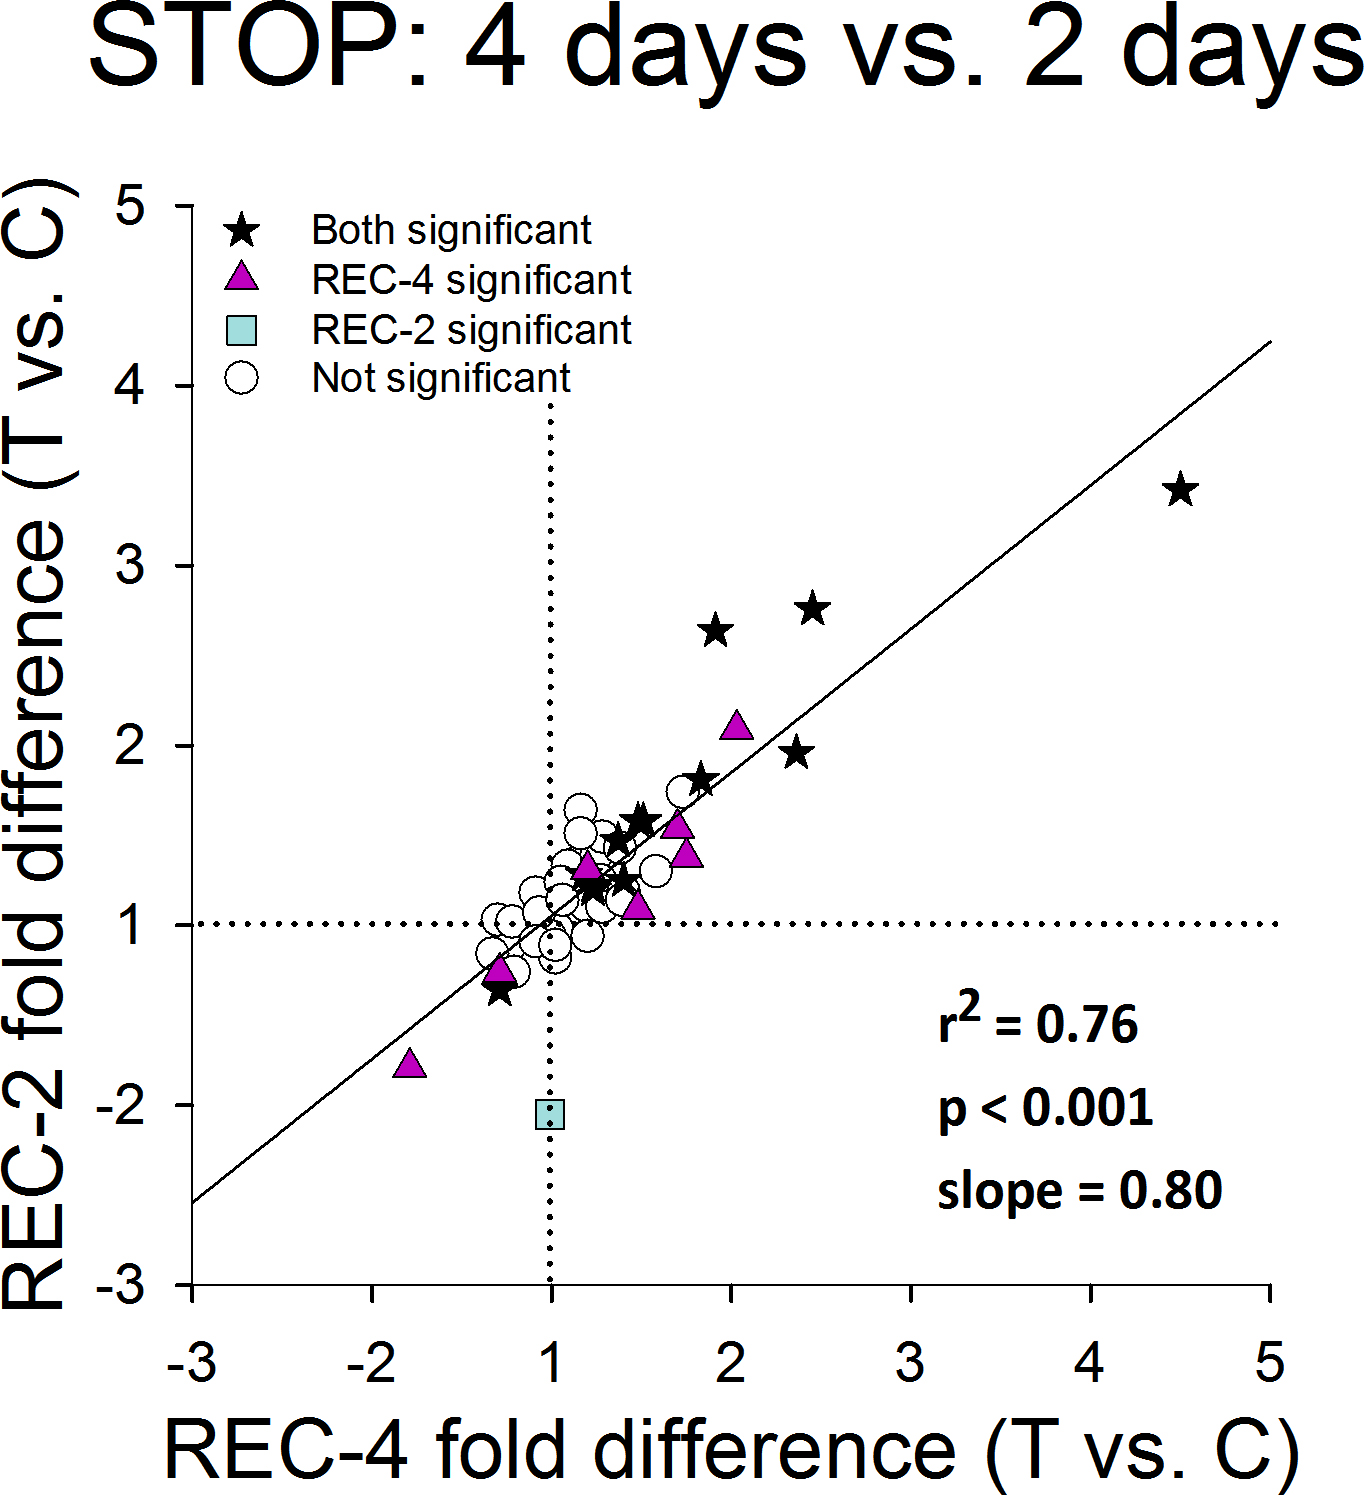
Figure 7. Gene expression differences. Comparison of the gene expression differences (treated eye [T] versus control eye [C]) in
Figure 5E (REC-4) with the differences in
Figure 5D (REC-2). The amount of differential expression in both conditions was similar. Stars represent significant fold differences
for both REC-4 and REC-2; triangles represent significant fold differences only for REC-4; squares represent significant fold
differences only for REC-2; circles show fold differences not significant in either treatment.
 Figure 7 of
Guo, Mol Vis 2014; 20:1643-1659.
Figure 7 of
Guo, Mol Vis 2014; 20:1643-1659.