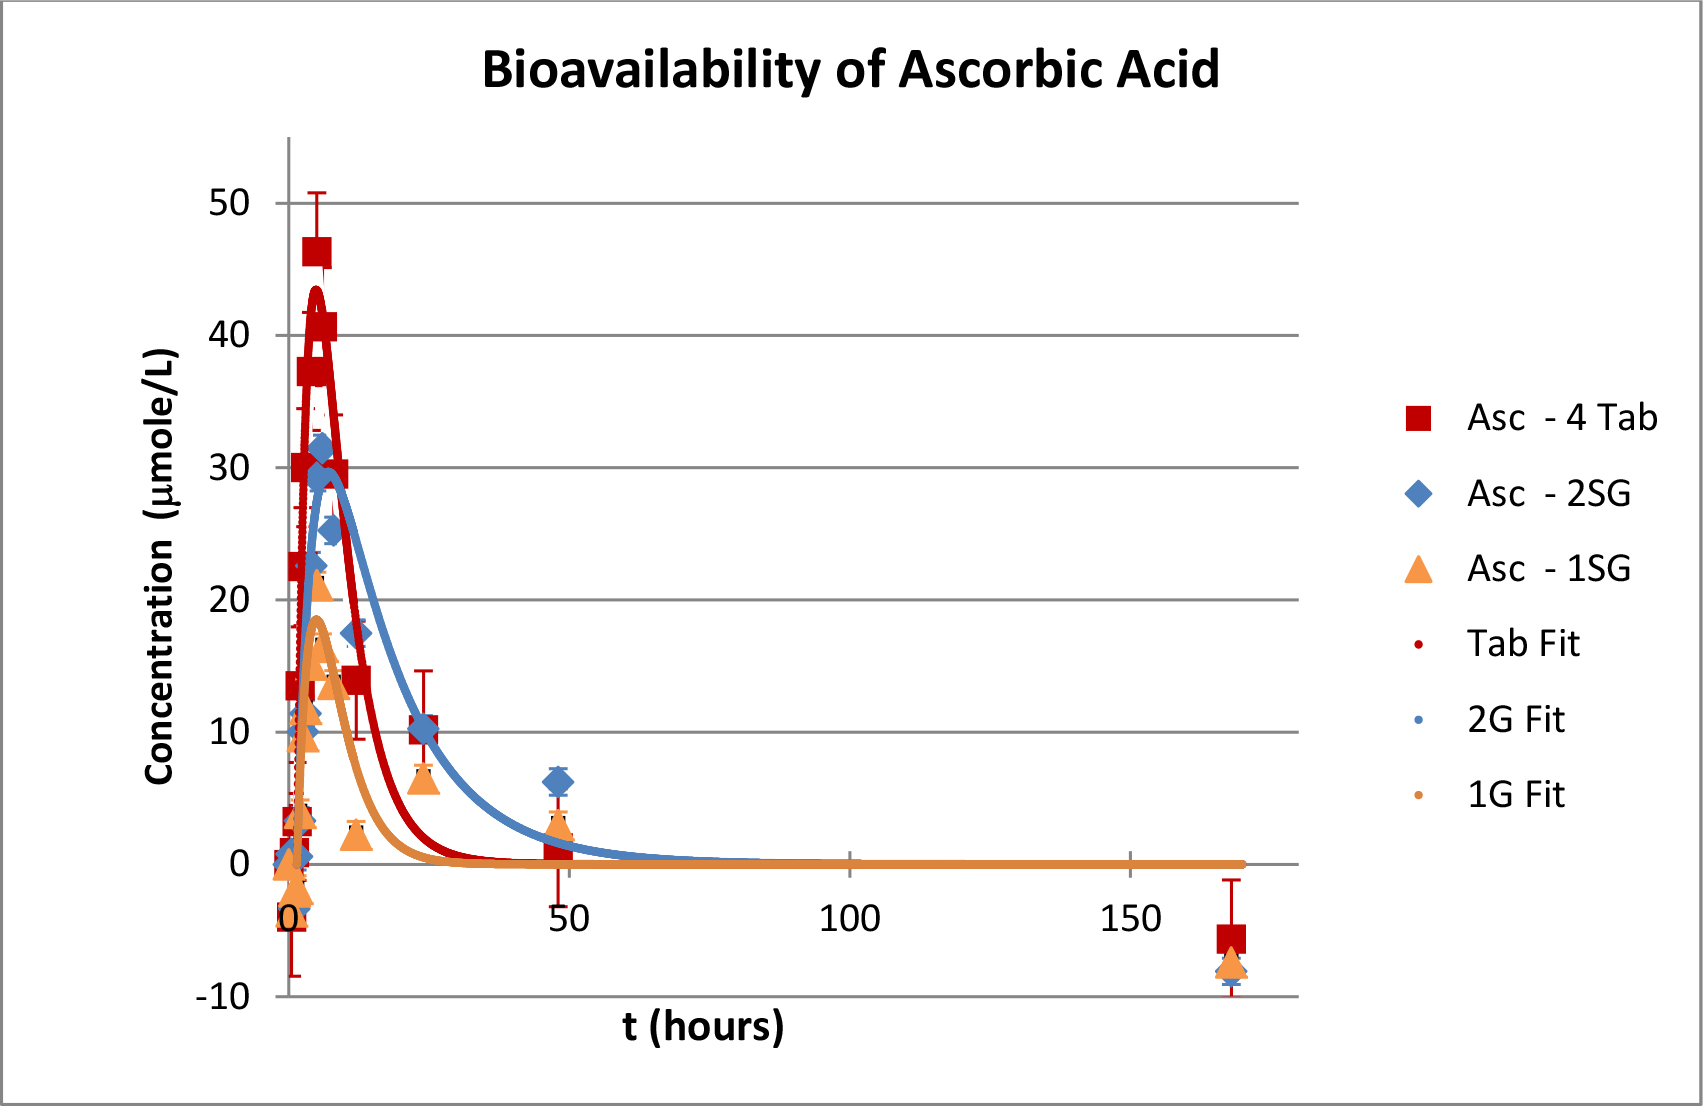
Figure 4. Experimental data (as symbols, with standard error bars) and model fits (smooth curves) regarding the bioabsorption for ascorbic
acid derived from four (red, 452 mg/day), two softgels capsules (blue, 452 mg/day), or one softgel capsule (orange, 226 mg/day).
The data points are the average responses of the 15 subjects adjusted for any baseline drift over the course of the study.
The model fits are the result of minimizing the errors between the data points and curves at the sampled times. Differences
in responses are evident in the model-independent evaluations located in
Table 2 and
Table 3, the model-dependent visual comparisons, and the derived AUCs and percent absorbed located in
Table 4.
 Figure 4 of
Johnson, Mol Vis 2014; 20:1228-1242.
Figure 4 of
Johnson, Mol Vis 2014; 20:1228-1242.