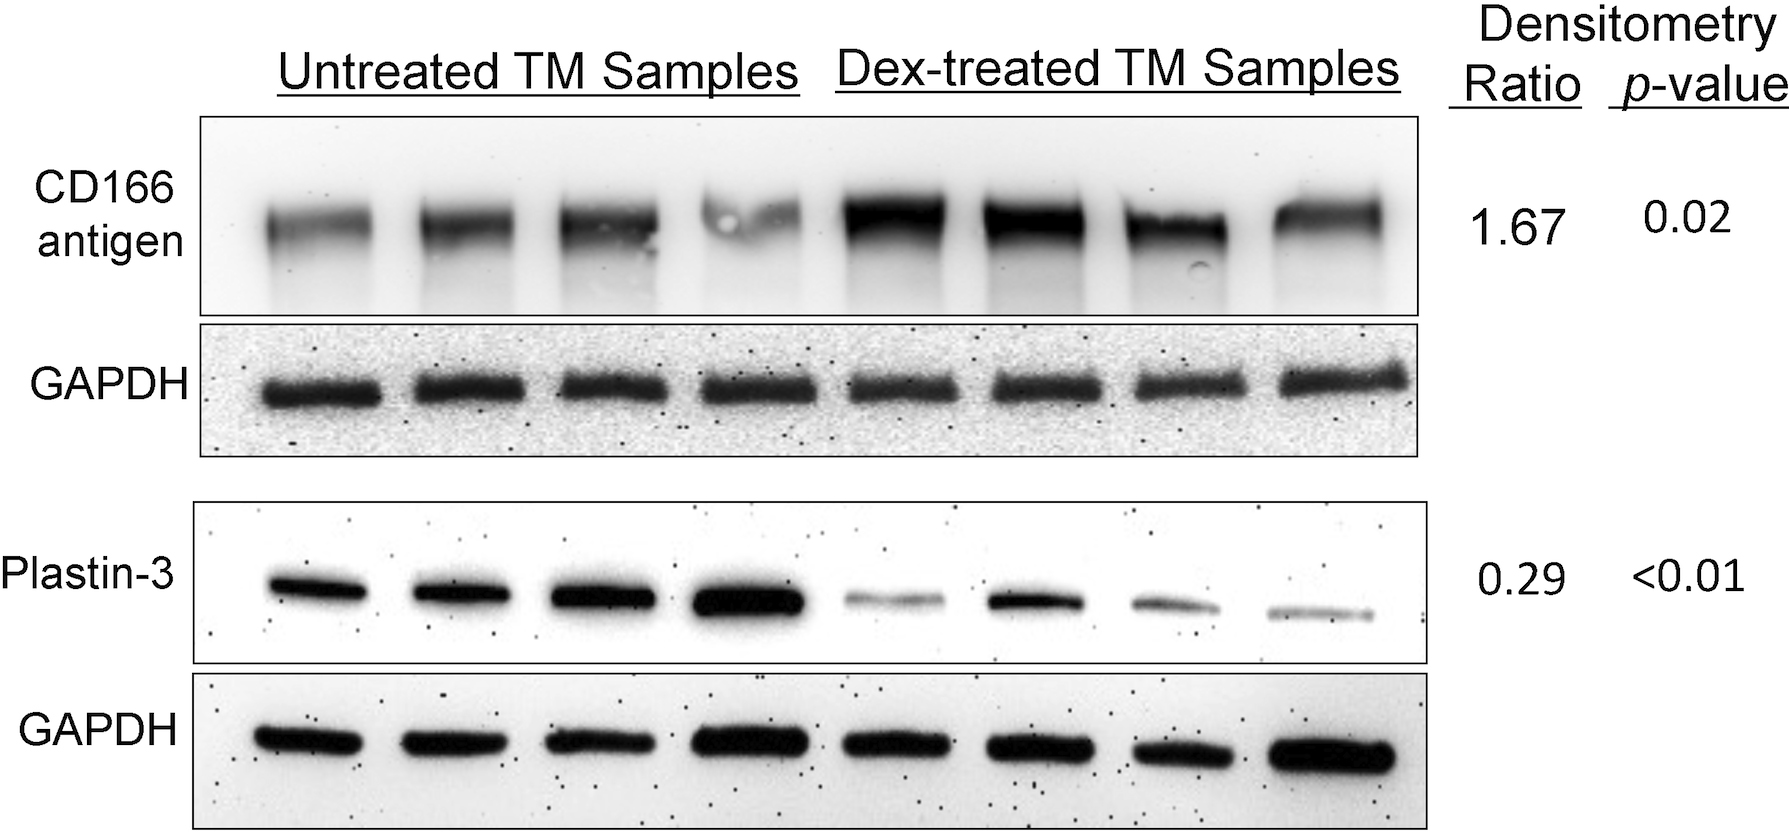
Figure 3. Western analyses. Western
blot analysis was used to evaluate the relative amounts of
proteins in Dex–treated and untreated TM cells (n=4 samples
each). Immunoblot intensities were normalized to GAPDH; average
densitometry ratios (Dex–treated/untreated) and p values
(two-sided
t-test) for CD166 antigen (ALCAM) and
Plastin-3 support the quantitative data in
Table 2
and
Table 3.
 Figure 3
of Bollinger, Mol Vis 2012; 18:2001-2011.
Figure 3
of Bollinger, Mol Vis 2012; 18:2001-2011.