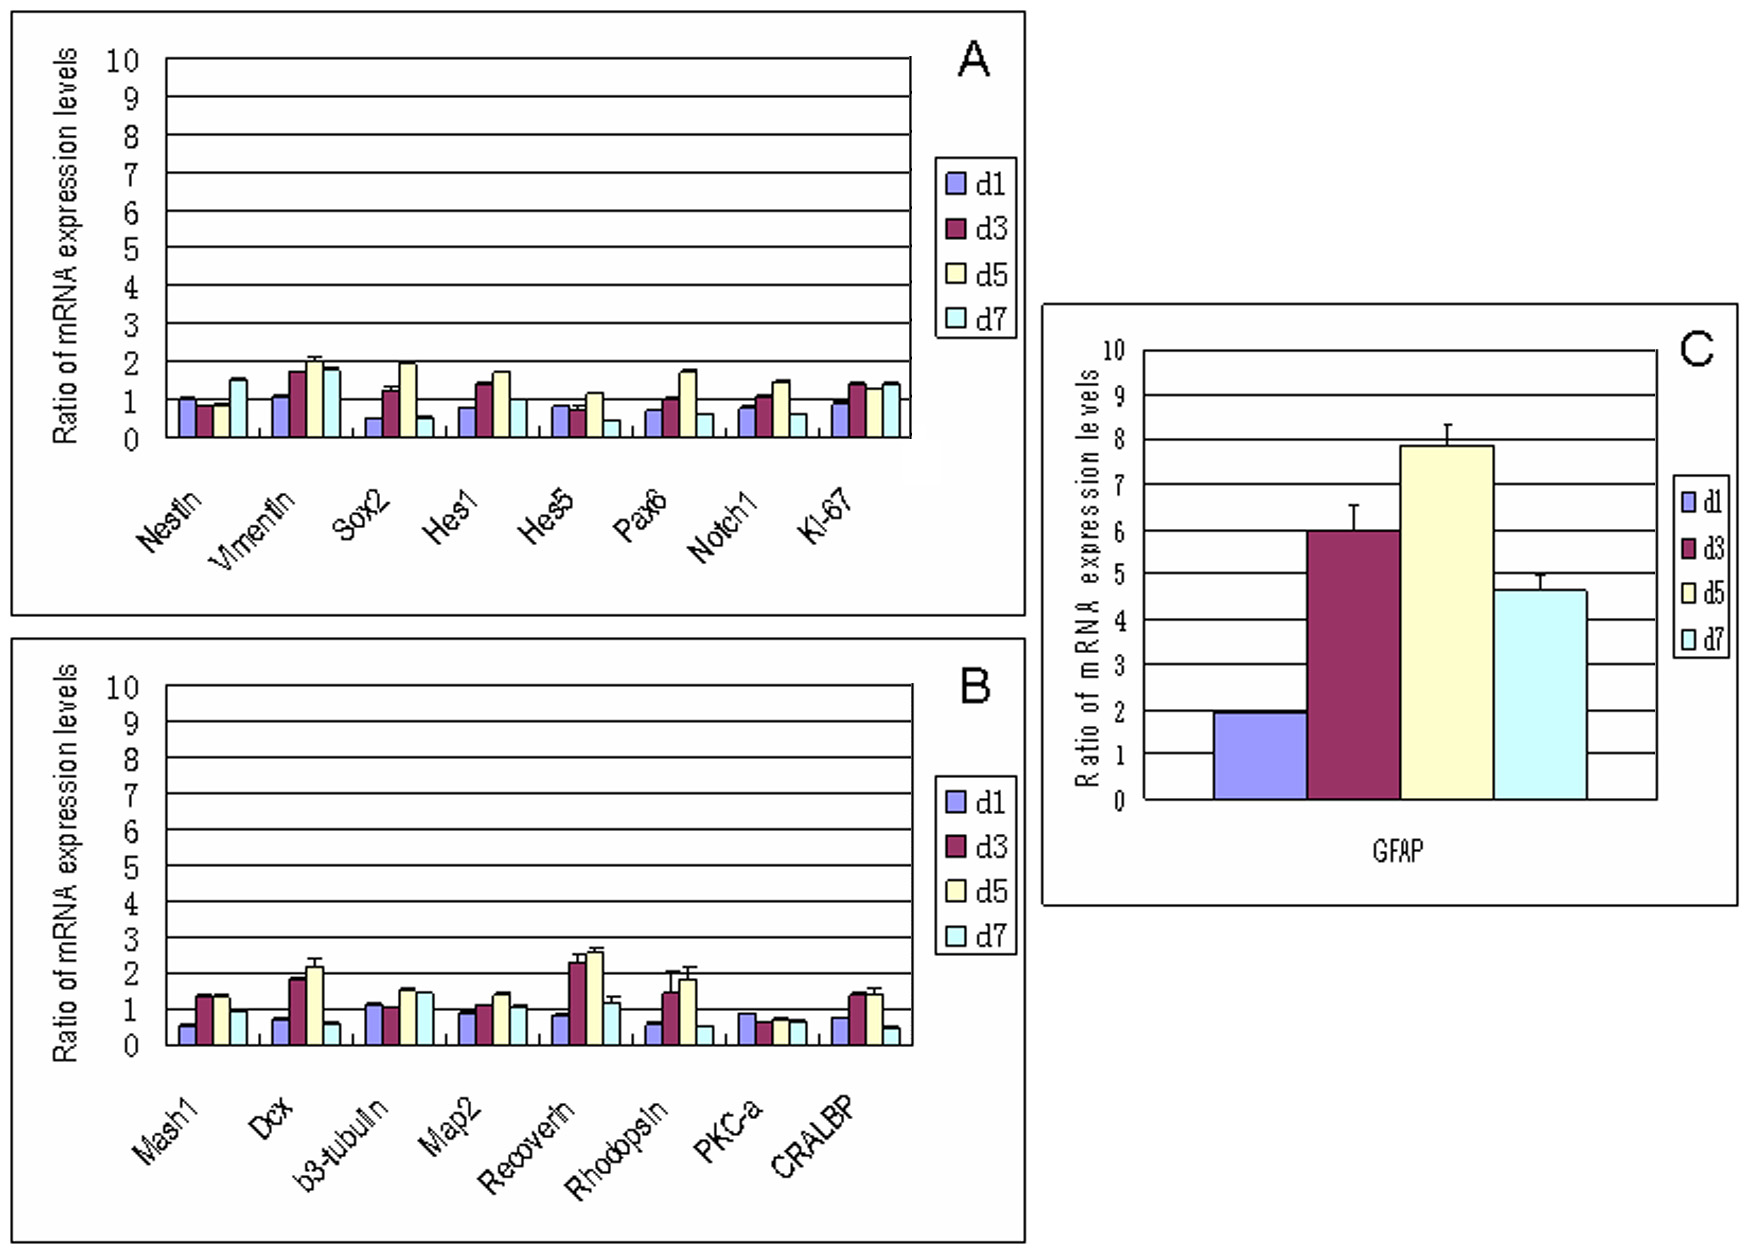
Figure 6. Effect of EGF+CNTF on gene
expression profile of RPCs by qPCR.
A: Expression levels of
progenitor markers did not vary notably except for marginal increases
in
vimentin and
Sox2.
B,
C: Except for
an increase in
GFAP, which was small compared to the data in
Figure 2,
Figure 3, and
Figure 4,
expression of lineage and differentiation markers varied only slightly,
with recoverin and
DCX showing modest increases. Abbreviations:
day 1 (d1), day 3 (d3), day 5 (d5), day 7 (d7).
 Figure 6 of Gu, Mol Vis 2009; 15:2111-2122.