Figure 3. Effect of FBS on gene expression profile of RPCs by qPCR. The transcripts examined included markers associated with immaturity
(A) nestin, vimentin, Sox2, Hes1, Hes5, Pax6, Notch1, and Ki-67, as well as markers associated with lineage specification (B) Mash1, DCX, β3-tubulin, Map2, recoverin, rhodopsin, PKC-α, CRALBP, and (C) GFAP. The glial marker GFAP is presented separately because of the markedly greater expression levels. FBS treatment resulted
in upregulation of most genes examined over the period of investigation, although none as substantially as GFAP. Abbreviations: day 1 (d1), day 3 (d3), day 5 (d5), day 7 (d7). The error bars show standard deviation.
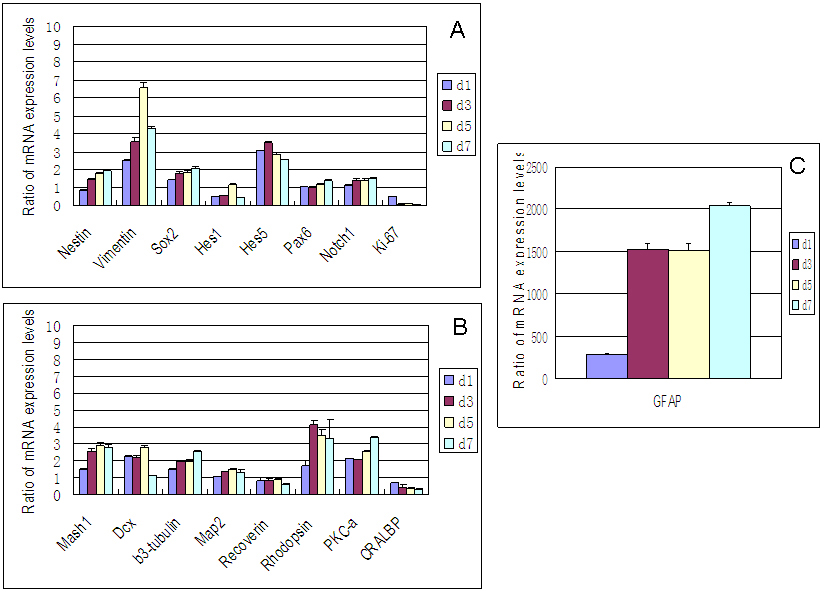
 Figure 3 of
Gu, Mol Vis 2009; 15:2111-2122.
Figure 3 of
Gu, Mol Vis 2009; 15:2111-2122.