Figure 4. Effect of CNTF on gene
expression profile of RPCs by qPCR. With CNTF treatment, expression of
the proliferation marker Ki-67 decreased sharply
while other progenitor markers were downregulated slightly or remained
unchanged, with the exception of vimentin and Hes5,
which increased (A). Most lineage and differentiation markers (B,
C) were upregulated and tended to progressively increase from
day 1 to day 7. Abbreviations: day 1 (d1), day 3 (d3), day 5 (d5), day
7 (d7). The error bars show standard deviation.
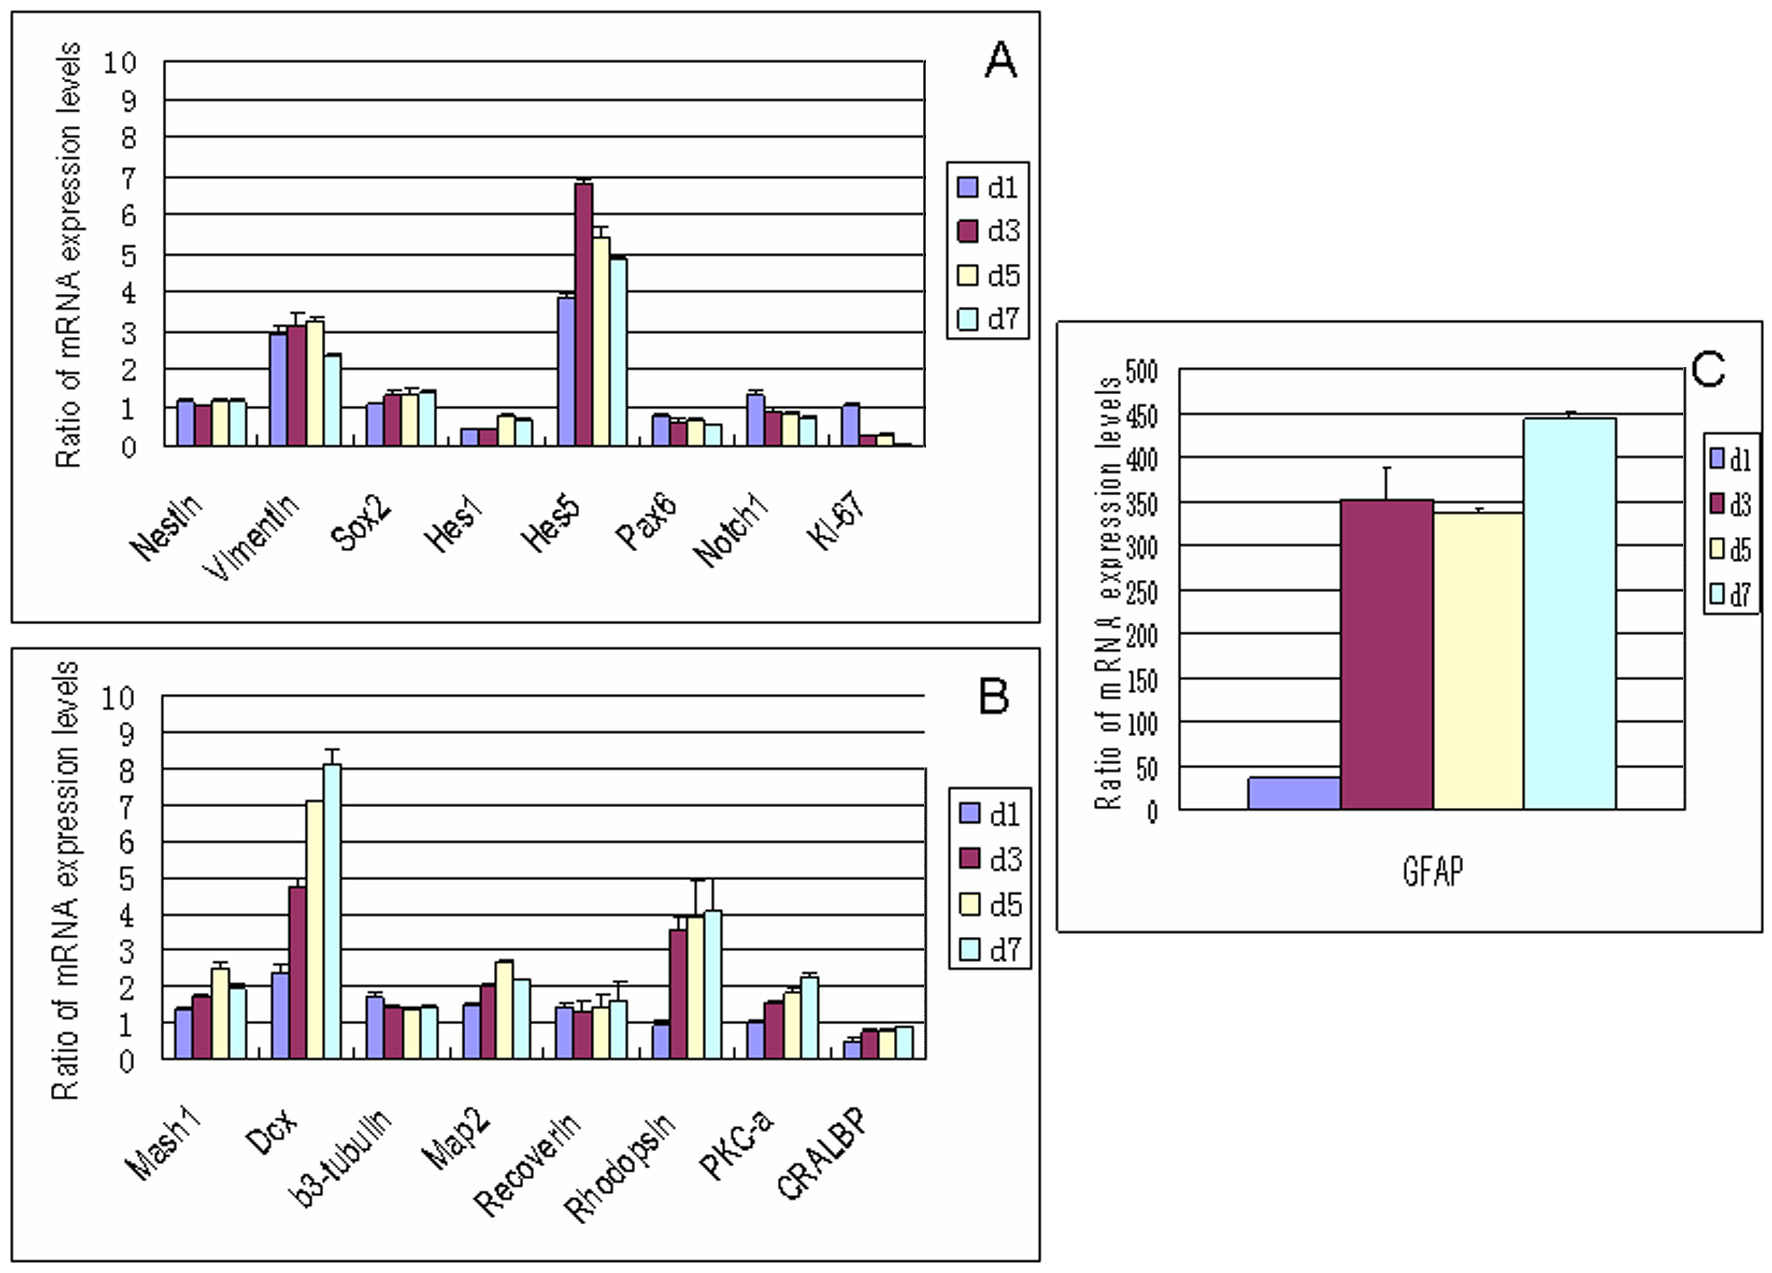
 Figure 4 of Gu, Mol Vis 2009; 15:2111-2122.