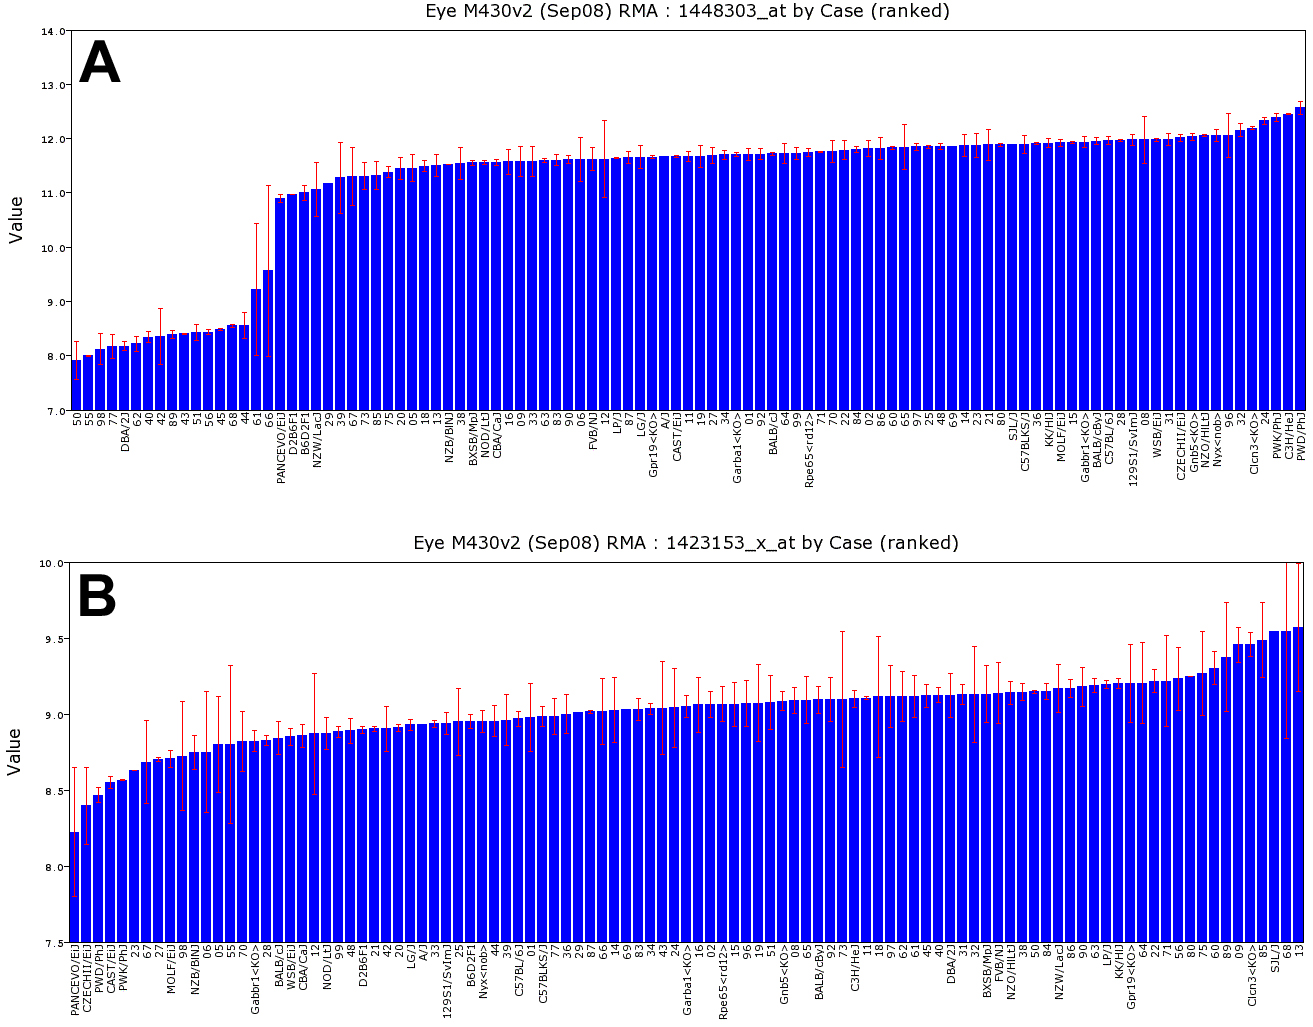
Figure 3. Variation in gene expression.
These bar charts summarize data for
Gpnmb and
Chf
across 103 strains, with strain names or numbers along the x-axis (BXD1
is abbreviated 01). The y-axis indicates expression on a log2 scale.
Bars are standard errors of the mean.
A: Variation in gene
expression of the glaucoma gene
Gpnmb (probe set 1448303_at)
indicates that fifteen BXD strains have low expression and can be used
as models for glaucoma, retinal ganglion cells degeneration, and
defects of innate immunity [
80].
The 25-fold decrease in expression of
Gpnmb in DBA/2J and 15 of
the new BXD strains (left side) is caused by a mutation that introduces
a premature stop codon in the middle of exon 4 (R150X, CGA to TGA, Chr
6 nucleotide 48.974971 Mb) [
10,
80]. This mutation
eliminates the target region of the transcript and enhances
nonsense-mediated RNA decay of the truncated transcript. This variation
in expression maps as a strong cis QTL.
B: There is a 2.6 fold
range of expression of complement factor H (
Cfh), probe set
1423153_x_at) this is determined by generating bar charts of strain
variation in gene expression.
How
to generate bar charts of strain variation in gene expression.
Step 1. Work through the steps described in
Figure 1 using
Gpnmb as
the search term in Step 1. Step 2. Once you have opened the Trait Data
and Analysis Form shown in
Figure 4 below, select the '
Basic
Statistics' button.
 Figure 3 of Geisert, Mol Vis 2009; 15:1730-1763.