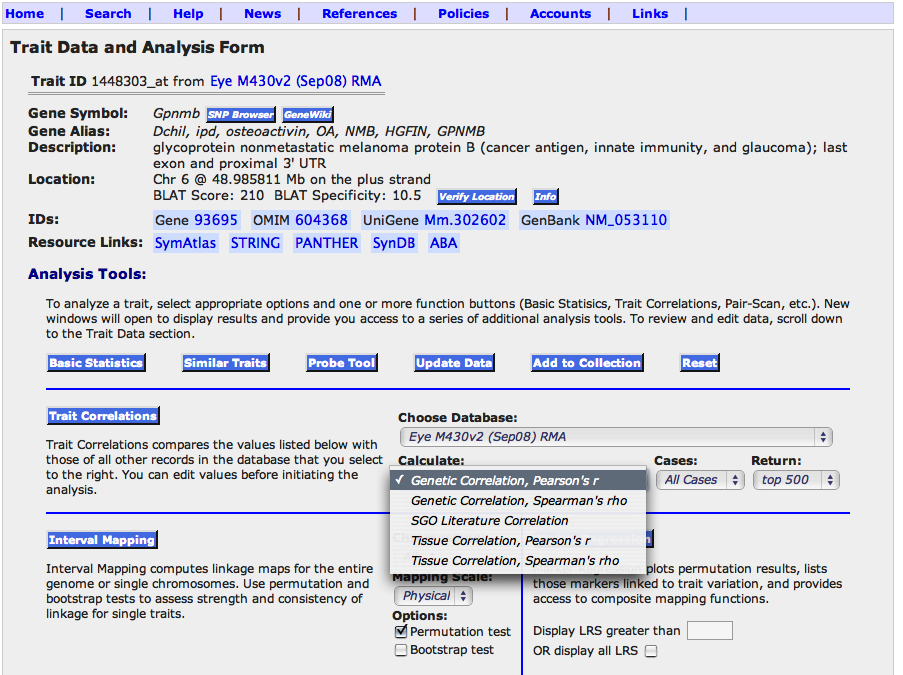
Figure 4. Analysis tools available from the Trait Data and Analysis Form. These functions are used to study data on variation and covariation
of gene expression. The 11 function buttons do the following: 1. '
SNP Browser' lists known single nucleotide polymorphisms (SNPs) in
Gpnmb among all strains for which data are available. 2. '
GeneWiki' provides a tool for any user to annotate any gene and leave references and notes on their expression. 3. Verify Location
function is used to retrieve the precise genomic location of probe from the UCSC Genome Browser. 4. The '
Info' button explains the Verify Locations function above. 5. The '
Basic Statistics' function generates simple univariate statistics, including the heritability index. Selecting this function generated the
bar charts reproduced in
Figure 3. 6.The '
Similar Traits' function finds expression data for
Gpnmb in other tissues such as the cerebellum, striatum, hippocampus, neocortex, kidney, and liver. 7. The '
Probe Tool' provides access to the low level probe data (CEL file level data). 8. '
Add to Collection' moves
Gpnmb expression data for the 71 BXD family members into a BXD Trait Collection window (similar to a shopping cart) that can include
over 100 other expression or trait data for these particular strains. 9. The '
Reset' function resets all values to their original values and settings (values in the Trait Data and Analysis form can be edited
by the user during an analysis). 10. The '
Trait Correlation' function finds the top data sets with matched expression patterns using complementary methods shown in the pull-down menu:
Genetic Correlations (strain correlations generated using the
HEIMED data itself), Semantic Gene Organizer (SGO) Literature Correlations, and Tissue Correlations. By default this function will
return the top 500 covariates, but this can be changed from the top 100 to the top 2000. 11. Interval Mapping tests whether
the variation in expression of a transcript in the BXD strains is strongly linked to sequence differences in a particular
part of the genome. Using this function for
Gpnmb generates a map that shows a strong QTL (LRS of 33.1) on Chr 6 at the precise location of the
Gpnmb gene itself.
 Figure 4 of
Geisert, Mol Vis 2009; 15:1730-1763.
Figure 4 of
Geisert, Mol Vis 2009; 15:1730-1763.