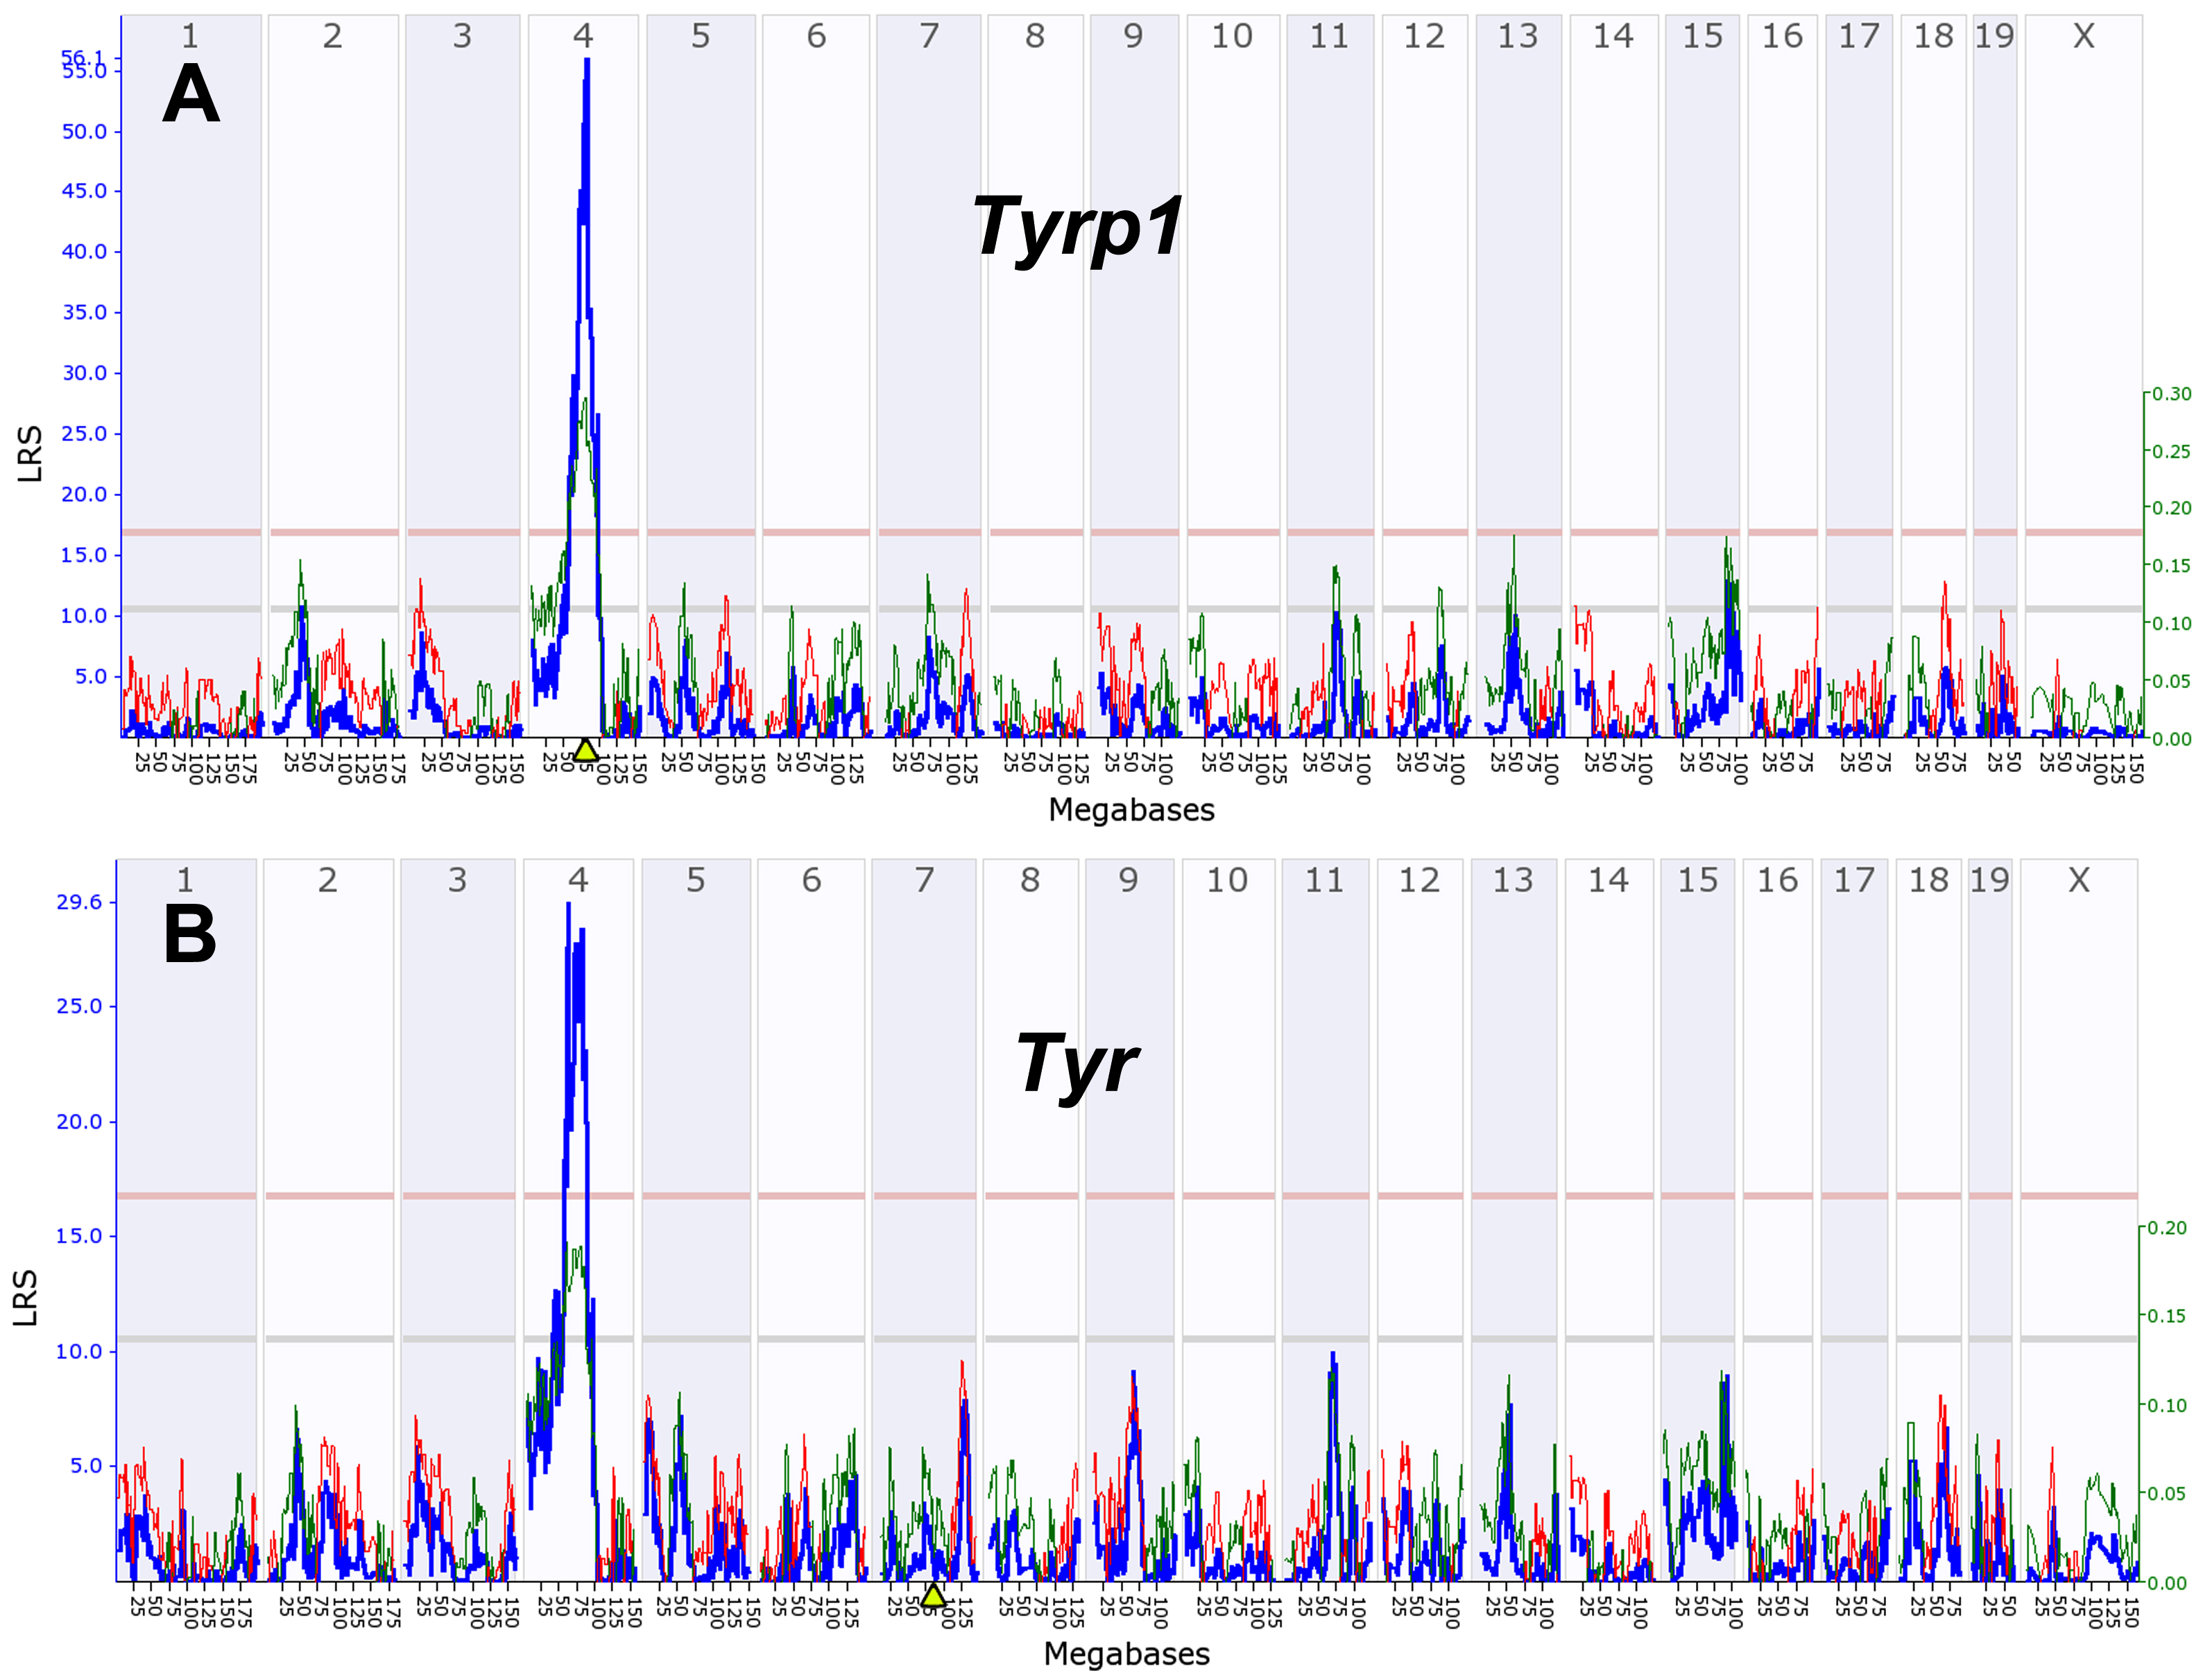
Figure 11. Genetic linkage maps of
Tyrp1
and
Tyr.
A:
Tyrp1 expression is controlled by a
cis QTL located on Chr 4 at 80 Mb. This location corresponds to the
location of the
Tyrp1 itself (triangle on x-axis and the LRS of
57) on Chr 4 at 80 Mb.
B: A similar map for
Tyr, a gene
that is located on Chr 7 but that has a strong trans-acting QTL. The
numbers along the top of each plot represent chromosomes. The y-axis
and the bold blue function provides the likelihood ratio statistic
(LRS=4.6 x LOD). The two horizontal lines across these plots mark
genome significance thresholds at p<0.05 (genome-wide significant,
red line) and suggestive threshold (p<0.63, gray line). The thin red
and green functions summarize the average additive effects of
D
and
B alleles among all BXD strains at particular markers. If
BXD strains with a
D allele have higher values than those with
a
B allele at a particular marker then the line is colored
green. In contrast, if strains with the
B allele have higher
mean values, the line is colored red. This additive effect size is
measure in log2 units per allele. In other words, an additive effect of
0.5 signifies a twofold difference in expression level between strains
with
BB and
DD genotypes at a marker (log 2 raised to
the power of 2×0.5).
How to
generate QTL maps: Step 1. Link to
expression data for a gene of interest using steps in
Figure 1.
For example, enter the search term “
Tyrp1” in the ANY field and
click the '
Search' button. Step 2. Click on
Tyrp1 in the
Search Results (probe set 1415862_at) to generate the Trait Data and
Analysis Form (
Figure
4). Step 3. Select the '
Interval Mapping' button in
this form (
Figure
4). This will initiate the analysis and display the
whole-genome interval map for
Tyrp1. The steps can be repeated
with
Tyr (1417717_a_at) to generate (panel
B). You can
now zoom in on a single chromosome (e.g., Chr 4) by clicking on the
chromosome numbers along at the top of the plot. You can also customize
the scale and features of the plot by entering appropriate parameters
in the control box.
 Figure 11 of Geisert, Mol Vis 2009; 15:1730-1763.