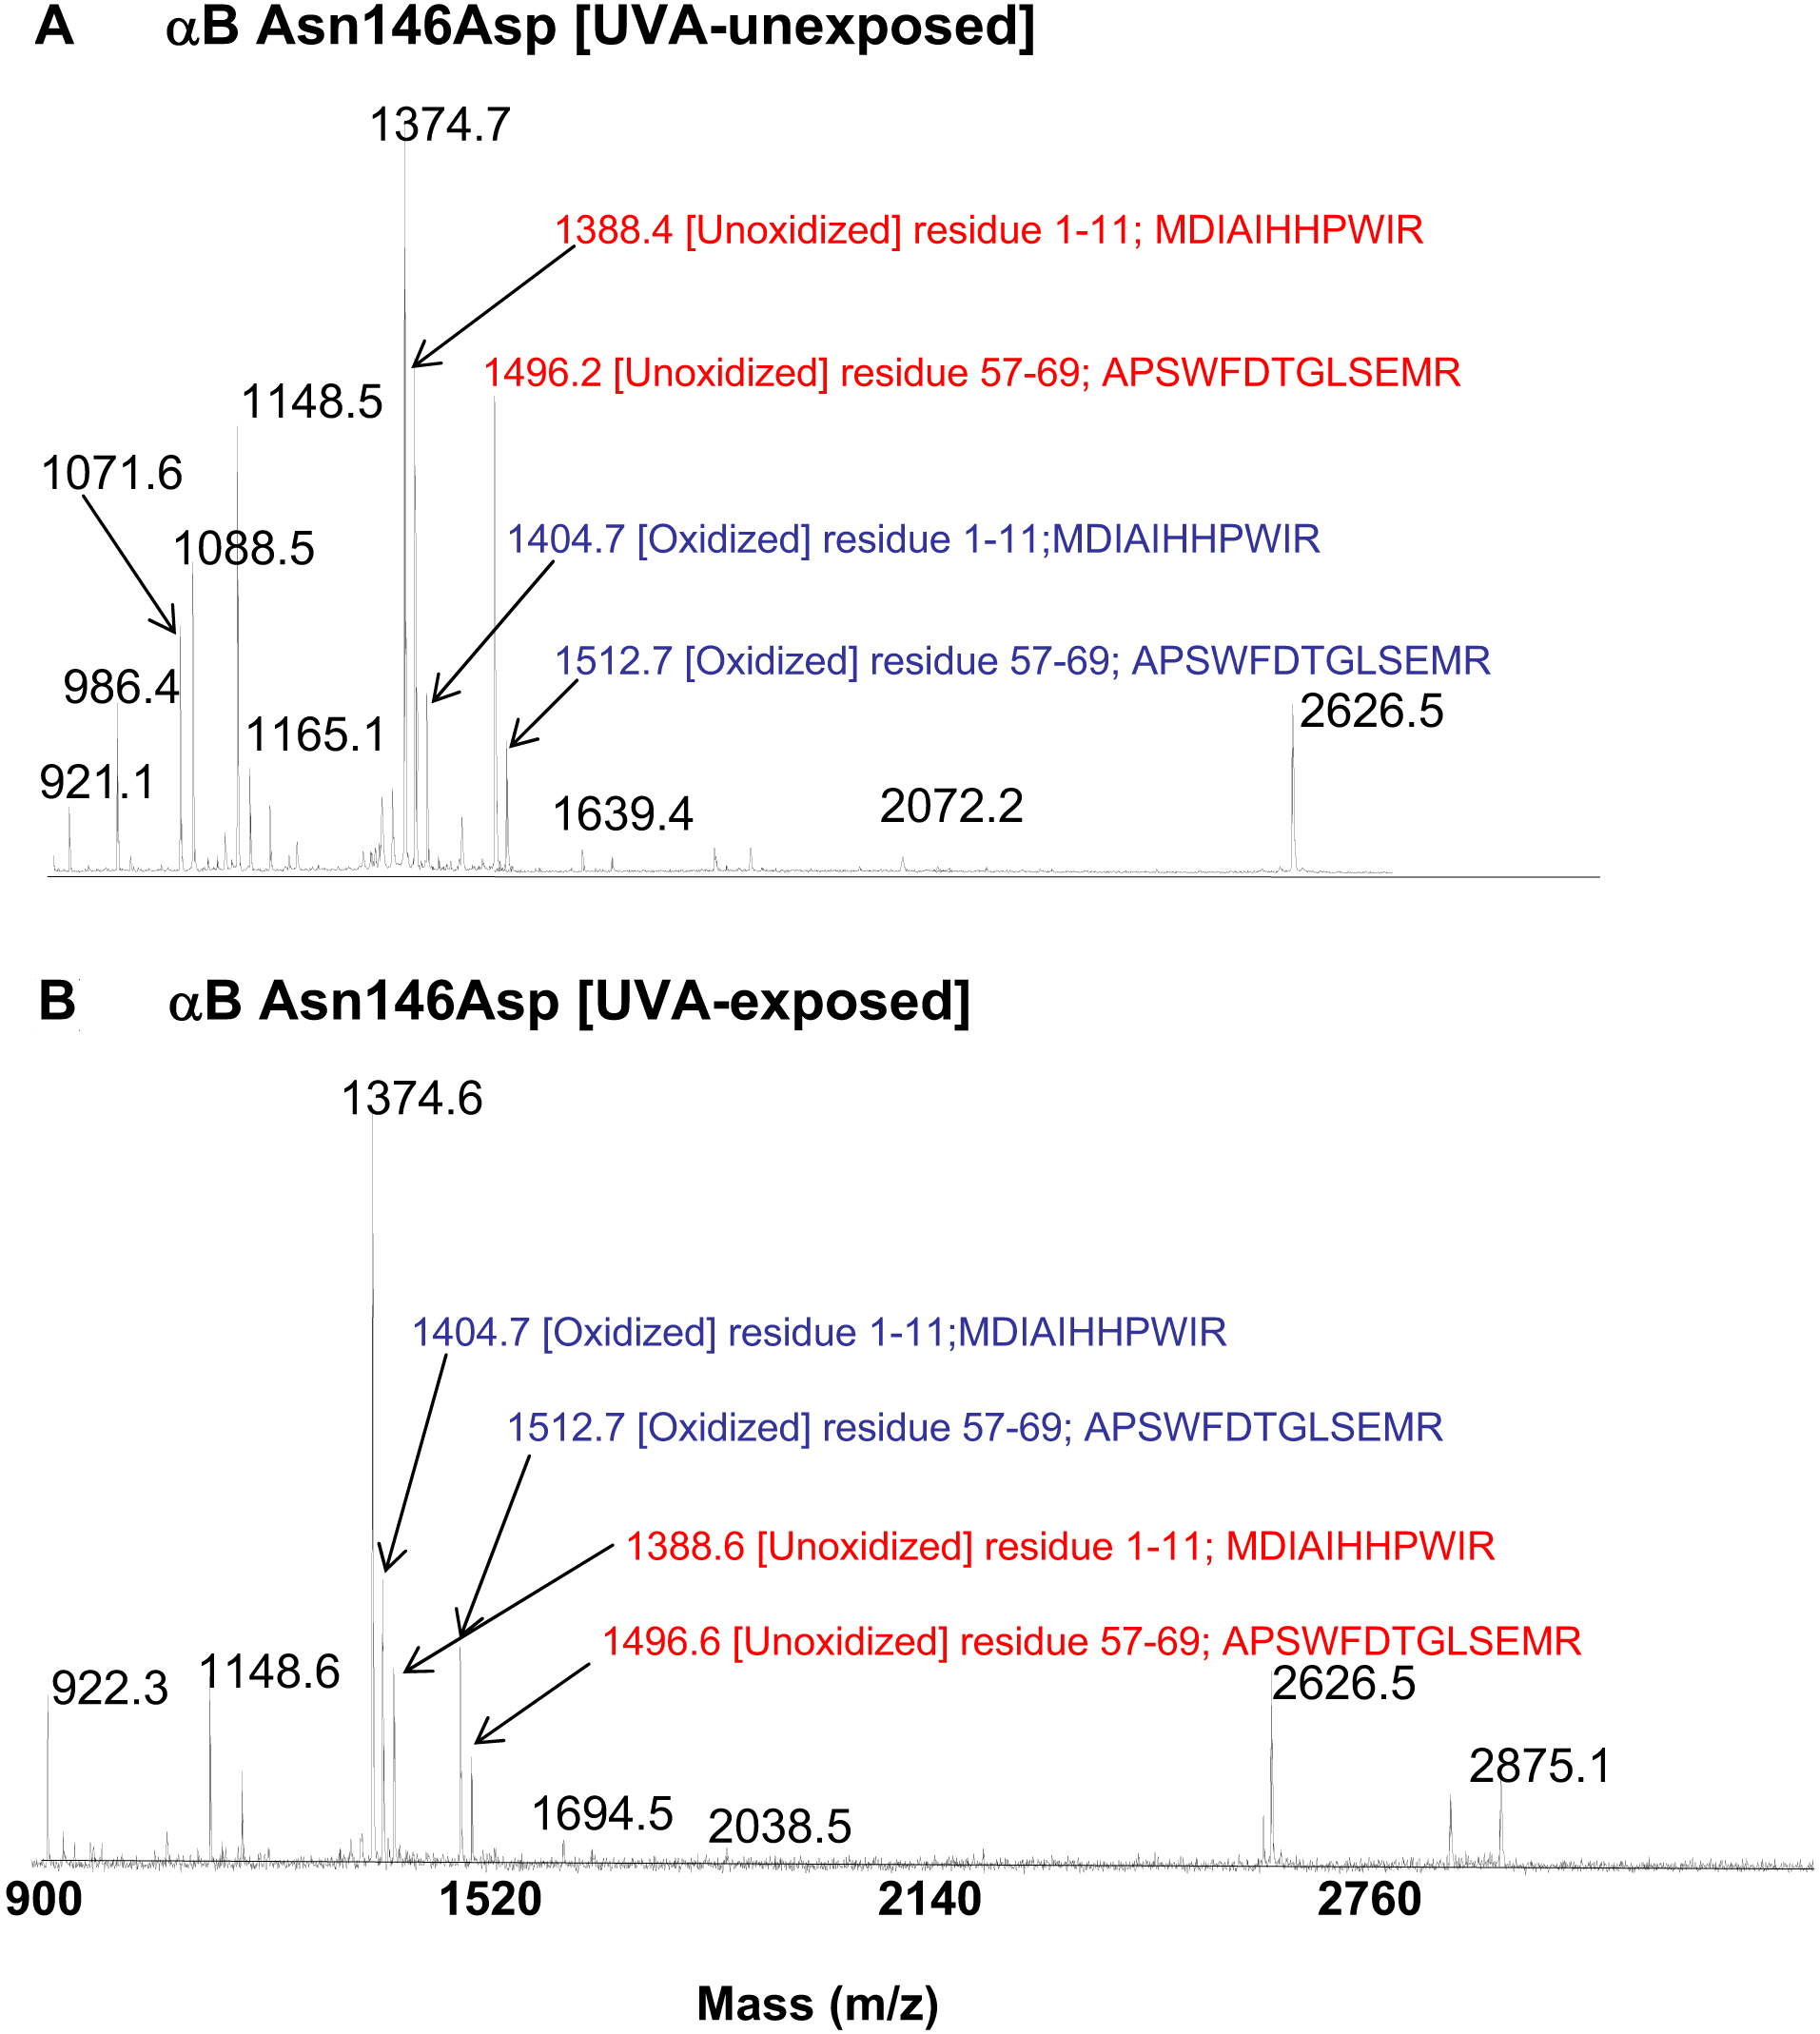
Figure 9. MALDI-TOF mass spectrometric
tryptic profiles of spot 1 in the UV-A-exposed and unexposed
αB-Asn146Asp mutant protein. The MALDI-TOF mass spectrometric tryptic
profiles of UV-A-unexposed αB-Asn146Asp mutant (
A) and
UV-A-exposed αB-Asn146Asp mutant (
B) is shown. The MALDI-TOF
profiles of WT αB-crystallin and αB-Asn78Asp and Asn78/146Asp mutant
proteins were similar to the profile of αB-Asn146Asp mutant protein as
shown in
Figure
9A and B. The profiles were used to determine oxidation of M
and W residue peptide 1 with residues 1–11 [MDIAIHHPWIR,
m/z
1388] and peptide 2 with residues 57–69 [APSWFDTGLSEMR,
m/z
1496]. The ratio of peak heights of oxidized (shown in blue) versus
unoxidized (shown in red) species of peptides 1 and 2 were calculated
used, and the data are shown in
Table 3.
 Figure 9 of Mafia, Mol Vis 2008; 14:234-248.