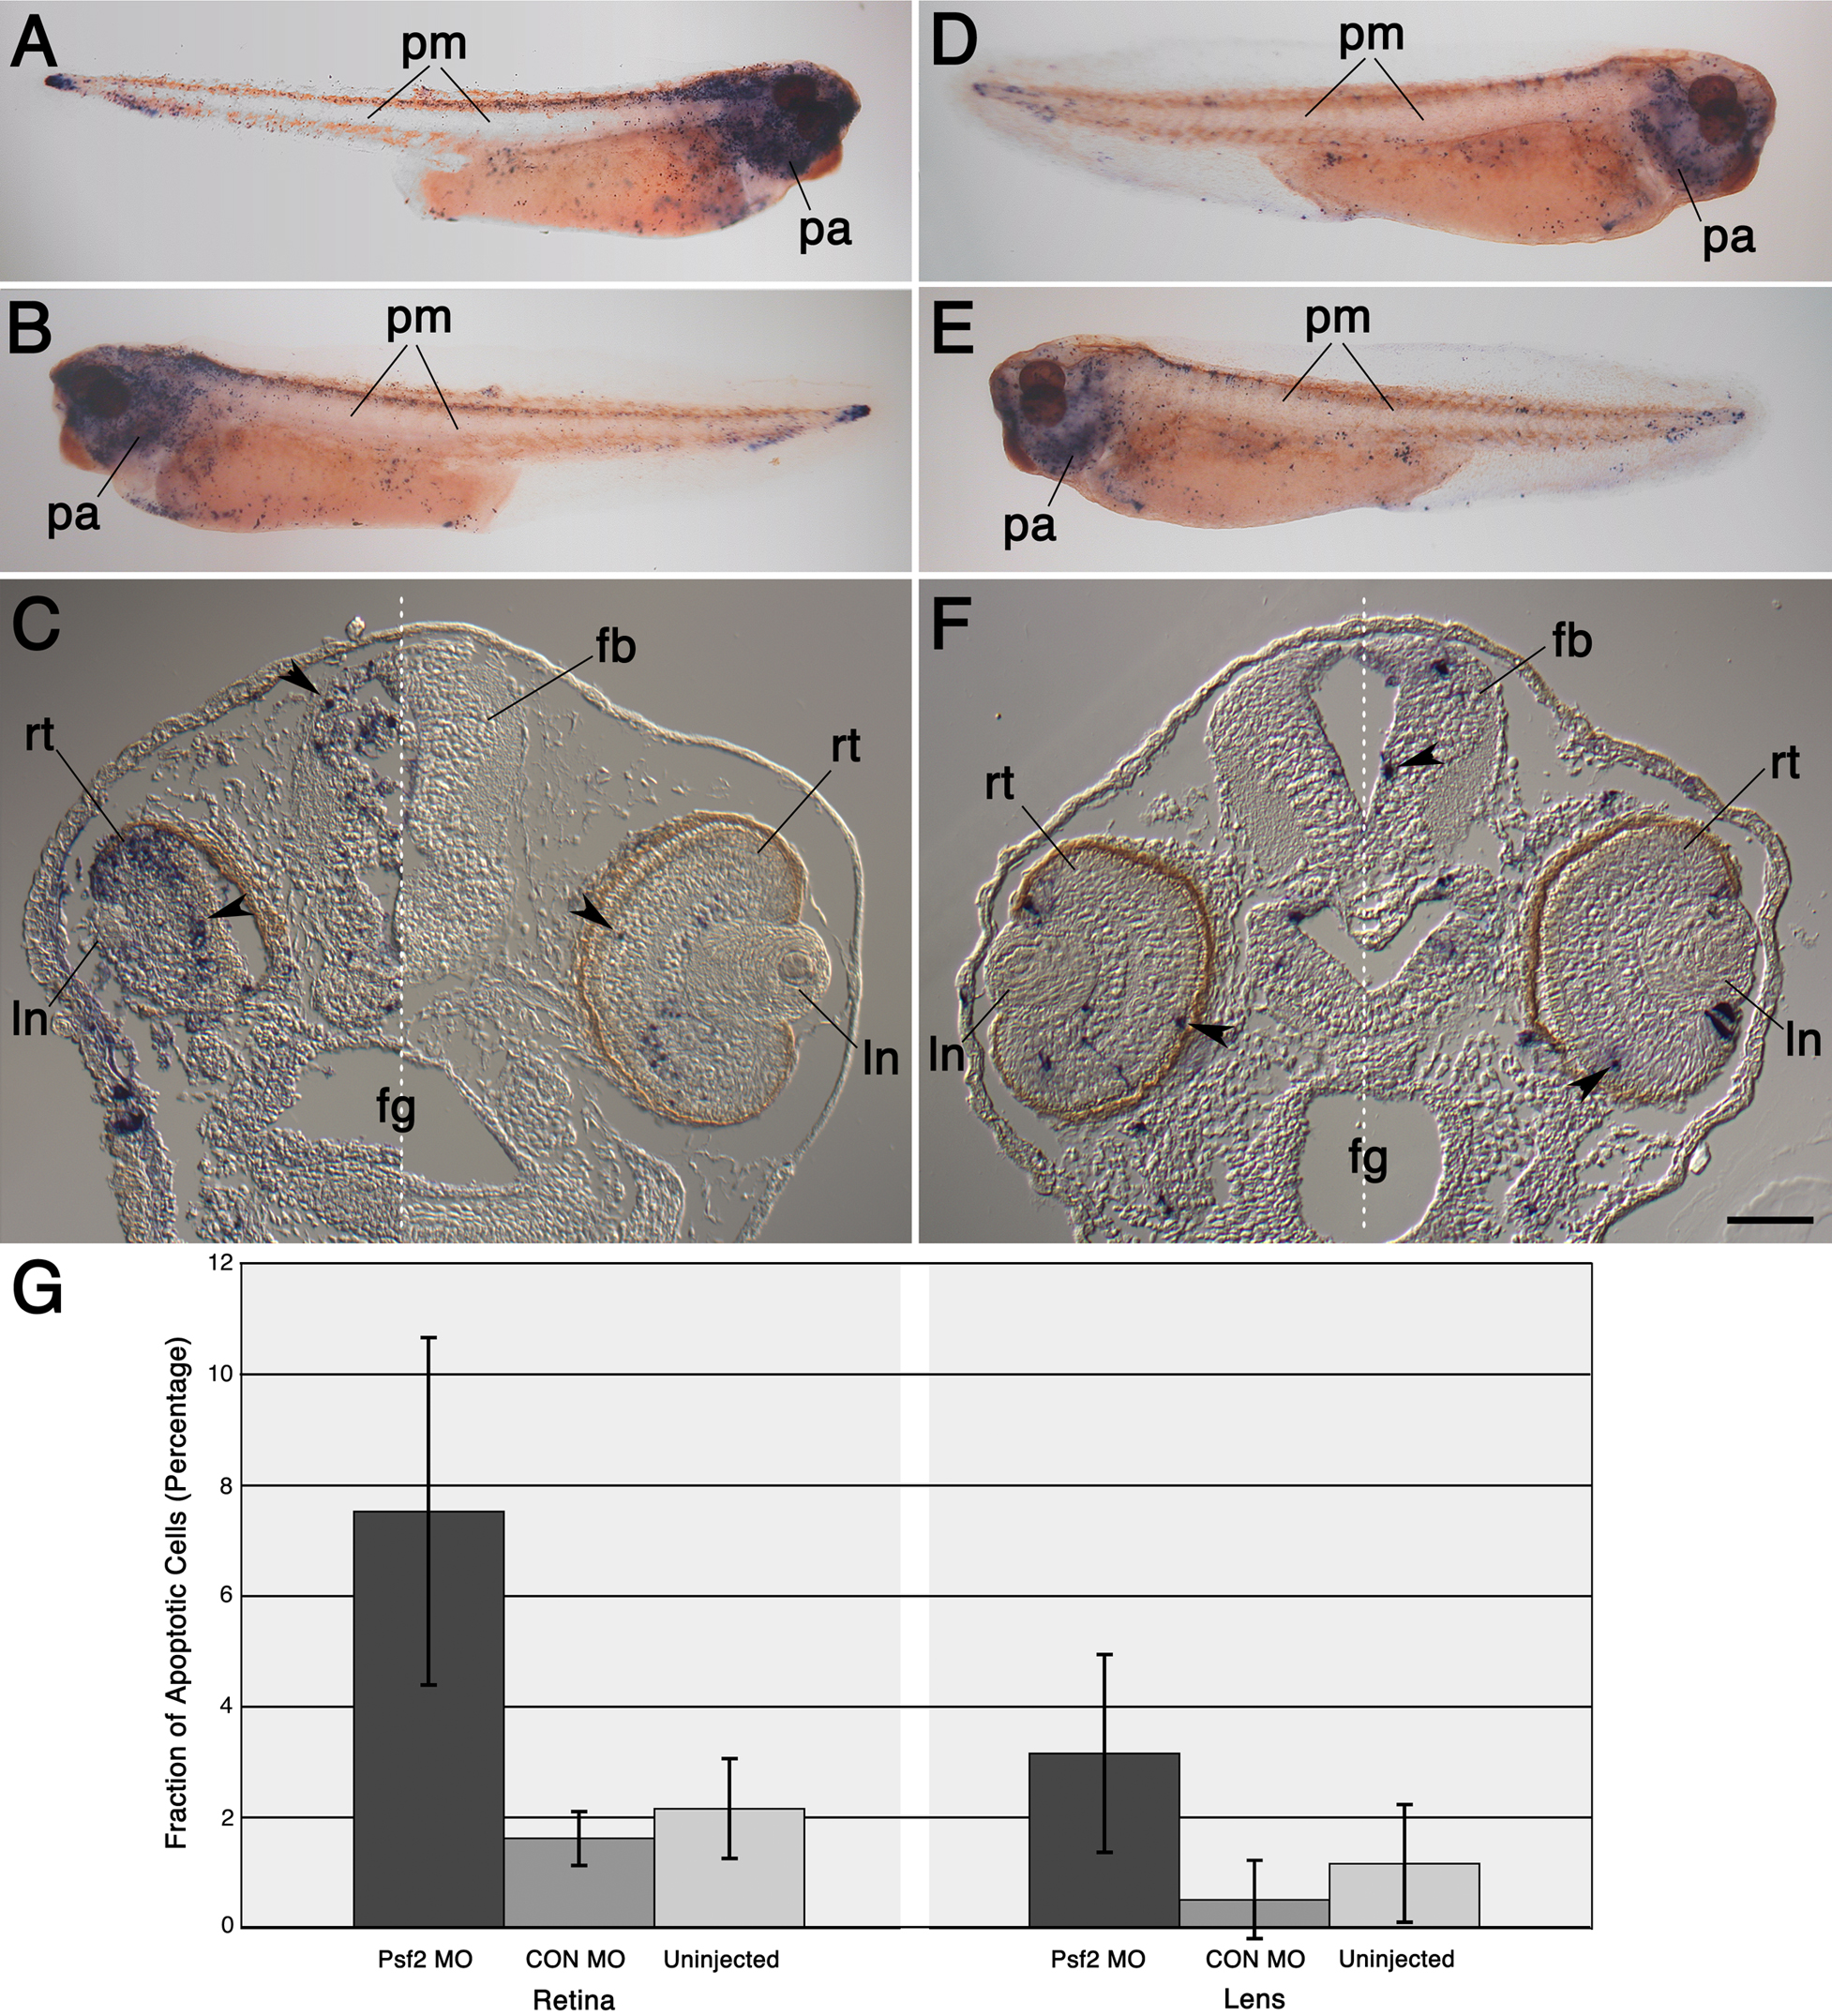
Figure 9. Effects of Psf2MO and CONMO
injections on the level of apoptosis.
A-B,D-E: Whole mount
examples show gross distribution of apoptotic cells (containing blue
colored NBT-BCIP precipitate). These whole mount embryos have been
cleared with BABB.
A and
B: These views of an embryo
show sides derived from Psf2MO-injected and uninjected blastomeres,
respectively.
C: Transverse section through the head of a
Psf2MO-injected embryo is shown. The white dashed line separates the
side containing tissues derived from the Psf2MO-injected blastomere (on
the left side of the figure) from those derived from the uninjected
blastomere (on the right side of the figure).
D and
E:
These views of an embryo show sides derived from CONMO-injected and
uninjected blastomeres, respectively.
F: Transverse section
through the head of a CONMO-injected embryo is shown. The white dashed
line separates the side containing tissues derived from the
CONMO-injected blastomere (on the left side of the figure) from those
derived from the uninjected blastomere (on the right side of the
figure). Note the increased level of apoptosis in head tissues derived
from Psf2MO-injected cells, especially in the forebrain and neural
retina (e.g., compare
A versus
D and
C versus
F).
Black arrowheads point to examples of labeled apoptotic cells within
the retina and brain.
G: A graphical depiction of the levels of
apoptosis in the neural retina and the lens is displayed. Bars
represent the mean fraction of apoptotic cells (depicted as a
percentage along the y-axis) while the different tissues and conditions
examined are depicted along the x-axis, as indicated. Error bars
representing the standard deviation are also shown. See Methods for
further details explaining the preparation of this data. Labels are the
same as those used in
Figure 1 and
Figure 4.
Scale bar in
F equals 600 µm for
A-
B and
D-
E
and 110 µm for
C and
F.