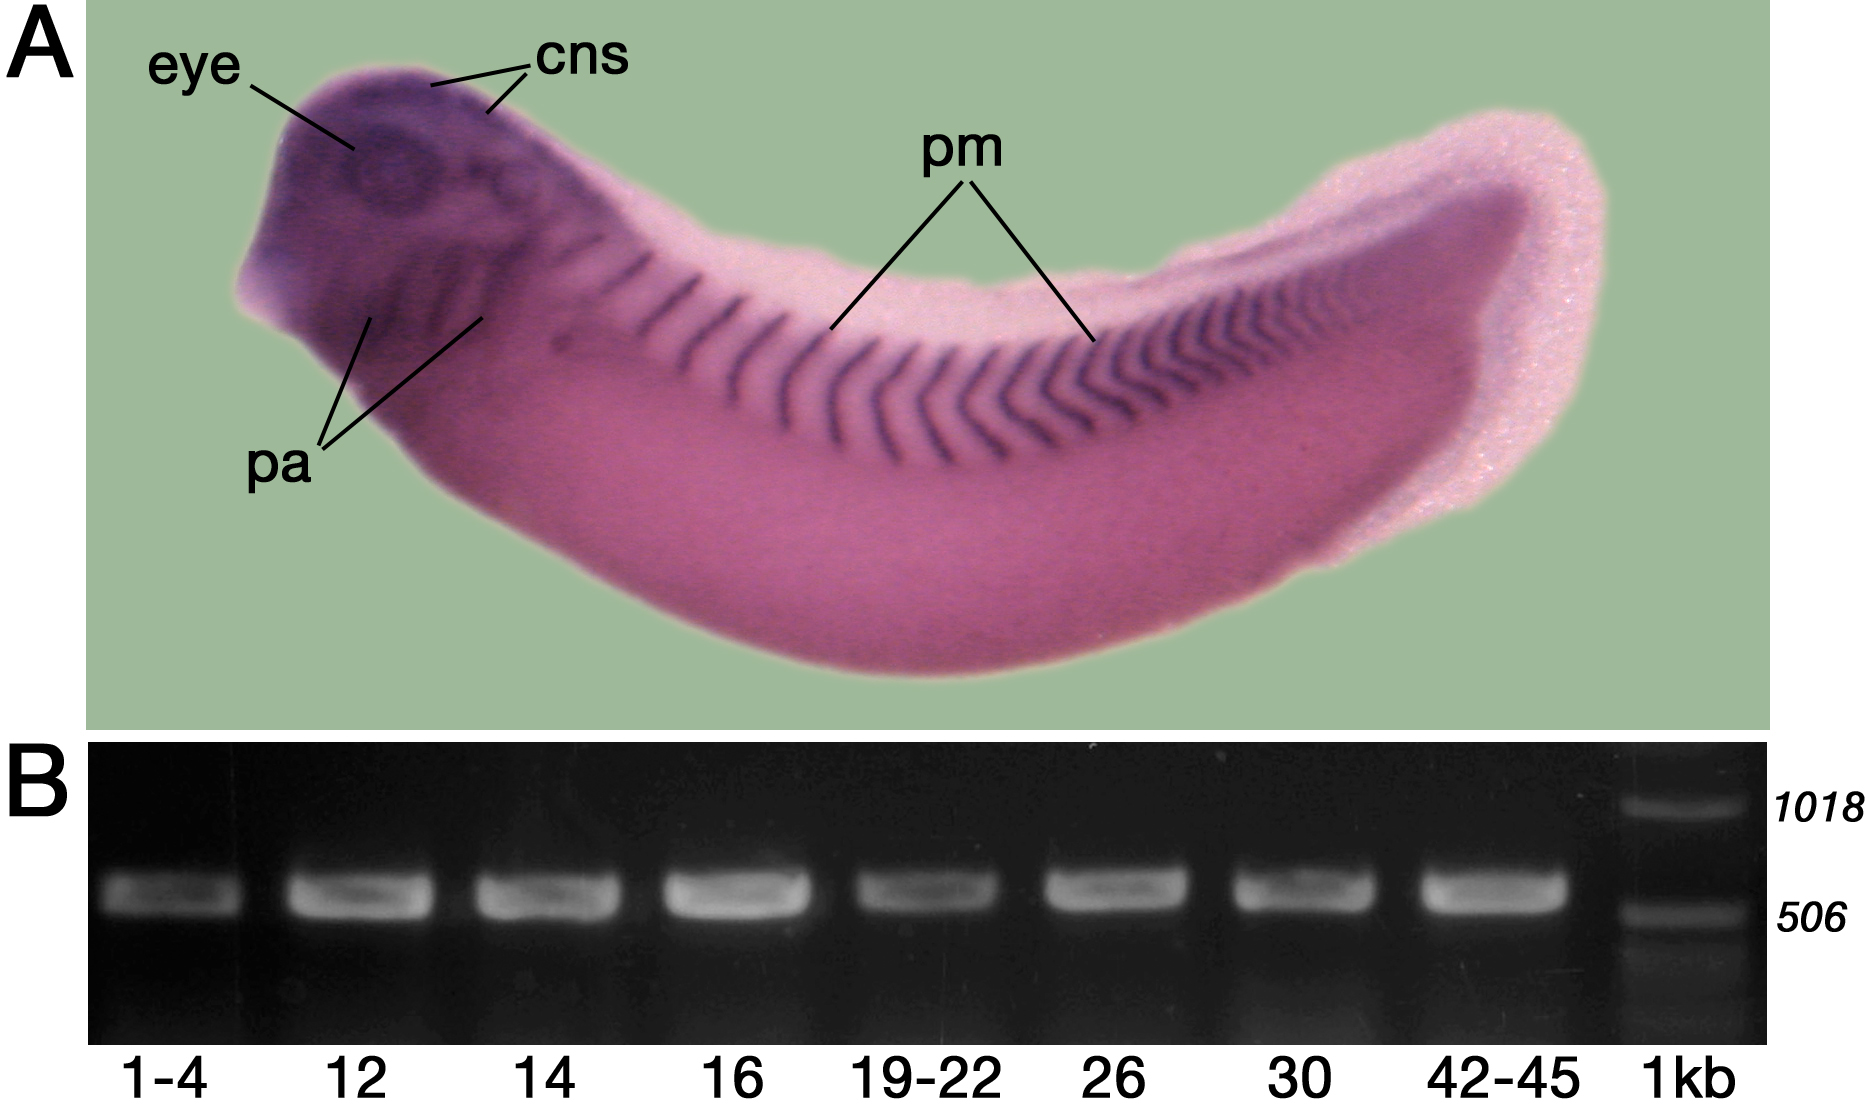
Figure 1. Embryonic expression of
Psf2.
A: An example of a whole mount in situ hybridization pattern
showing localization of
Psf2 in specific embryonic tissues
(stage 33) is shown. Note the expression in the brain (labeled as cns),
the retina and lens of the eye (labeled as eye), mesoderm of the
pharyngeal arches (labeled as pa), and in stripes representing a
reiterated subset of the paraxial (somitic) mesoderm (labeled as pm).
B:
RT–PCR analysis of
Xenopus laevis Psf2 at different stages of
embryogenesis, as noted (all stages follow those of [
15]). A portion of 1
kb ladder was run for reference (labeled as 1kb). The 1018 bp and 506
bp bands are labeled. Expected
Psf2 PCR product is 577 bp. For
simplicity, positive and negative control lanes are not shown here.