![]() Figure 8 of
McMahon, Mol Vis 2007;
13:258-272.
Figure 8 of
McMahon, Mol Vis 2007;
13:258-272.
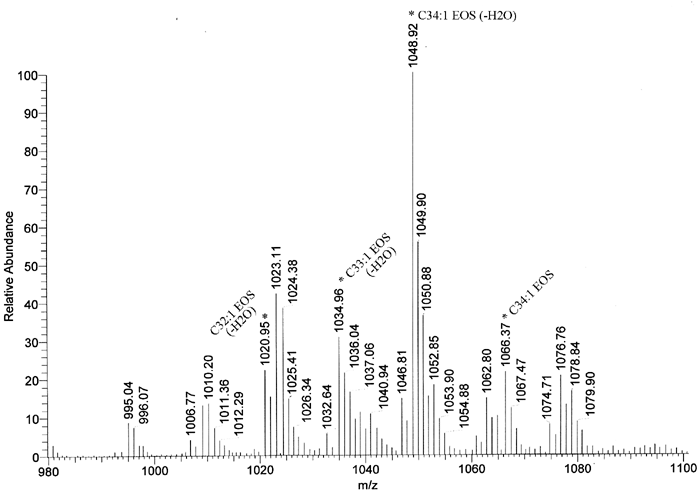
Figure 8. Acylceramides of wild-type mouse epidermis
Extended print-out of the acylceramides detected using positive ion mode MS analysis (Figure 7). It shows the 1066.37 m/z peak identified as C34:1-EOS by fragmentation analysis (see Figure 9) and the 1048.92 m/z peak of its dehydrated derivative. Signals 1020.95, and 1034.96 m/z correspond to C32:1-EOS, and C33:1-EOS, respectively. These are CH2-homologs of C34-EOS. Other peaks can be assigned as EOS ceramides containing varied degrees of fatty acid saturation or as minor acylceramide species (EOH and EOP) that contain an additional hydroxy group.