![]() Figure 7 of
McMahon, Mol Vis 2007;
13:258-272.
Figure 7 of
McMahon, Mol Vis 2007;
13:258-272.
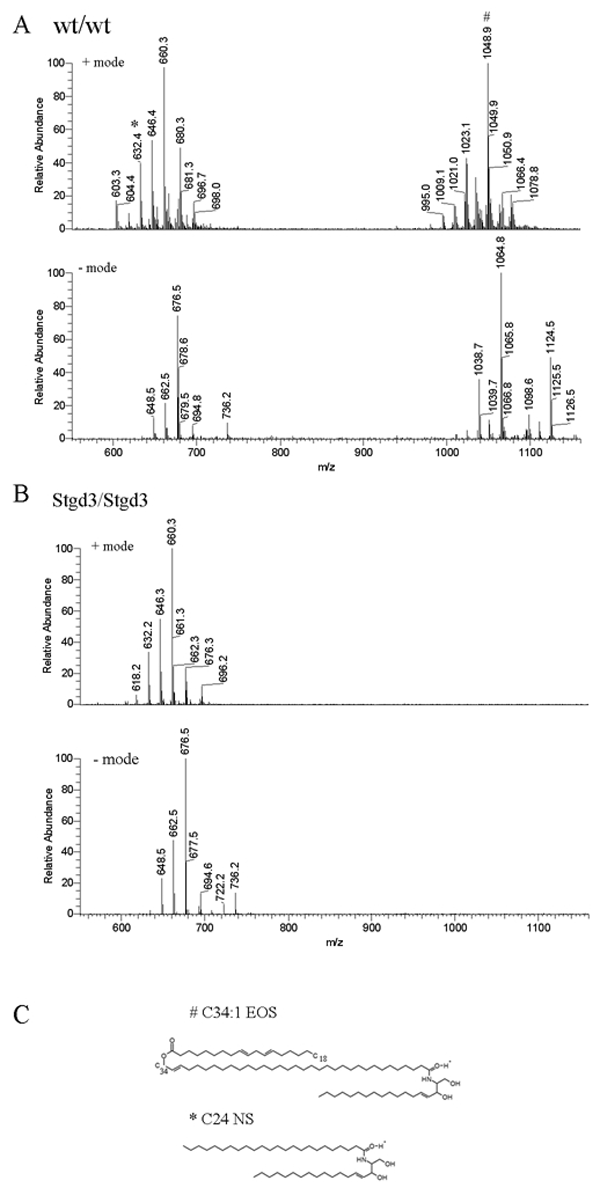
Figure 7. Epidermal ceramides in neonatal homozygous Stgd3 mice
Epidermal lipids were extracted and analyzed by high performance liquid chromatography/mass spectrometry (HPLC/MS). Full scan MS analysis of an HPLC ceramide fraction detected non-acylceramides (600-700 m/z) in both wt/wt (A) and Stgd3/Stgd3 epidermal extracts (B), but acylceramides (1000-1100 m/z) only in the wt/wt extract. Among non-acylceramides, we identified C24-NS ceramide based on a comparison with a commercial C24-NS standard (isotopic mass=649.63). M/z values for both were identical; 648.5 m/z in negative ion mode due to proton loss, and 632.4 m/z in positive ion mode due to proton gain and water loss. Also detected in both extracts were its CH2-homologs: C25-NS ceramide (662.5 and 646.4 m/z in negative and positive mode, respectively) and C26-NS ceramide (676.5 and 660.3 m/z, respectively). Among acylceramides in the wt/wt extract, we identified C34:1-EOS ceramide (isotopic mass 1066.00) based on an m/z value of 1064.8 in negative mode due to proton loss, and 1048.9 m/z in positive mode due to proton gain and water loss. Identity was further confirmed by fragmentation analysis (see Figure 9). Also present were CH2-homologs of C34-EOS containing varying degrees of fatty acid saturation (see Figure 8). C shows the structures of an acylceramide with a C34-fatty acid (C34:1-EOS) and a non-acylceramide with a C24 fatty acid (C-24-NS).