![]() Figure 3 of
Hanna, Mol Vis 2007;
13:2194-2208.
Figure 3 of
Hanna, Mol Vis 2007;
13:2194-2208.
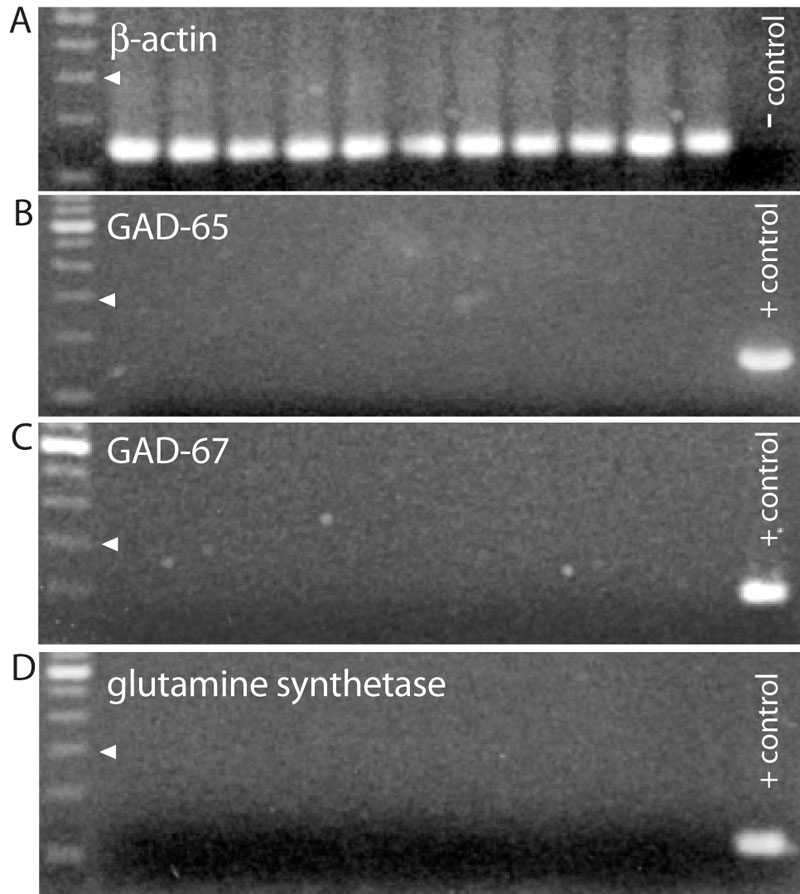
Figure 3. Positive and negative controls for rod bipolar cell cDNA
Gene-specific PCR from cDNA libraries was created using 3'-end amplification (TPEA) RT-PCR on RNA extracted from 11 representative rod bipolar cells, harvested as shown in Figure 2. A: Ethidium bromide-stained 2% agarose gel demonstrated expected PCR product for β-actin in each cell. Negative control run without reverse transcriptase from a bipolar cell was lacking product, as expected. B, C, D: Same rod bipolar cells tested negative for expression of genes expressed by horizontal cells (GAD-65 and GAD-67) and Müller glia (glutamine synthetase). Positive control was obtained using cDNA from fixed slice, as shown in Figure 1. Gels are truncated since only a single PCR product was detected for either β-actin (A) or the positive control (B, C, D). Arrowheads indicate 300 bp.