![]() Figure 3 of
Meij, Mol Vis 2007;
13:2012-2018.
Figure 3 of
Meij, Mol Vis 2007;
13:2012-2018.
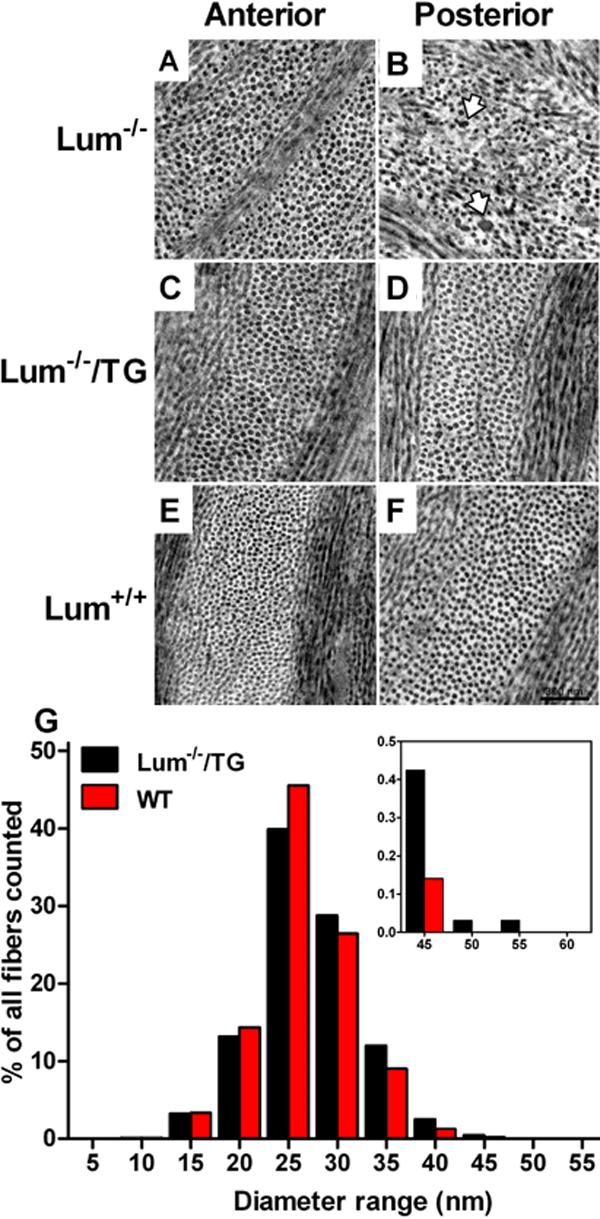
Figure 3. Ultrastructural analysis of stromal collagen matrix organization in corneas from Lum-/-, Lum-/-/Kera-Lum, and WT mice
After experiments represented in Figure 1 and Figure 2, mouse eyes were processed for transmission EM as described in Methods. A-F: EM images of anterior stroma (A, C, E) show little difference between groups whereas in EM images of posterior stroma (B, D, F), the matrix in Lum-/-/Kera-Lum (D) appears normal like in WT (F) and lacks the disarray and large-diameter fibrils (arrows) of Lum-/- (B). G: The distribution of fibril diameters (5 nm bins) in posterior corneal stroma is shown. Inset: frequency of fibrils larger than 40 nm. Data represent percent of 1815, 2224, and 1893 fibrils measured in Lum-/-, Lum-/-/Kera-Lum, and WT, respectively.