![]() Figure 8 of
Nickerson, Mol Vis 2006;
12:1565-1585.
Figure 8 of
Nickerson, Mol Vis 2006;
12:1565-1585.
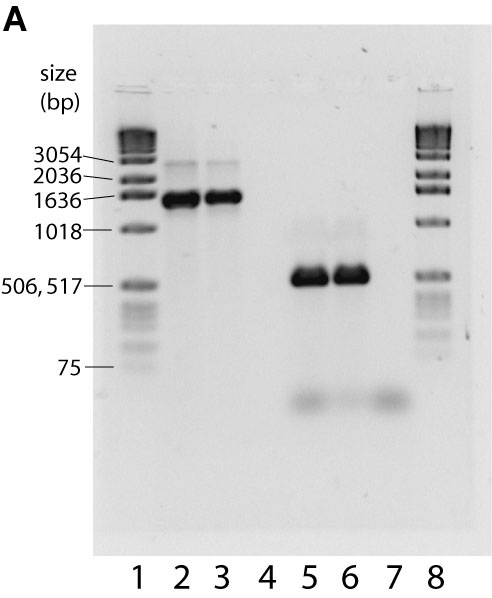
Figure 8. RT-PCR from Gene 1 or Gene 2-specific primers
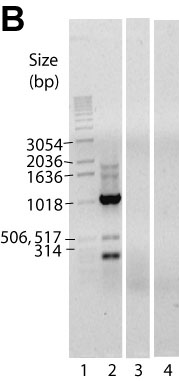
A: Expression of Gene 1 and Gene 2 in zebrafish tissues. Amplicon size was measured on a 1.0% agarose gel (and run in 1X TAE buffer) stained with 1X SYBR Green. Lanes 1 and 8, 0.5 μg 1 kb DNA ladder (Invitrogen, Carlsbad, CA). Lane 2, 96 h zebrafish whole larval RNA primed with gn1fwd and gn1rev (Table 2). Lane 3, adult zebrafish eye RNA primed with gn1fwd and gn1rev primers. Lane 4, no RNA control, primed with gn1fwd and gn1rev. Lane 5, 96 h whole larval RNA with gn2 primers, F3 and R4 (Table 2). Lane 6, adult zebrafish eye RNA, primed with gn2 primers, F3 and R4. In the absence of RNA, the F3 and R4 primers amplified no products (data not shown). Lanes 2 and 3 had a product of about 1500 bp, and the size expected from the Gene 1 DNA sequence was 1529 bp. Lanes 5 and 6 had a product of about 530 bp and an expected size based on the sequence of 532 bp. These results indicate that both genes are transcriptionally active in both zebrafish adult eye and larval whole bodies. Panel B: Expression of an RNA transcript spanning Gene 1 and Gene 2. Lane 1, 1 kb ladder (Invitrogen). Lane 2, an RT-PCR product spanning across the intergenic region using primers F1 and R3 (Table 1) was found with a size estimated to be 1000 bp (96 h larval RNA). Lane 3, same as Lane 2 in the absence of reverse transcriptase. Lane 4, no RNA control.