![]() Figure 5 of
Rozsa, Mol Vis 2006;
12:125-141.
Figure 5 of
Rozsa, Mol Vis 2006;
12:125-141.
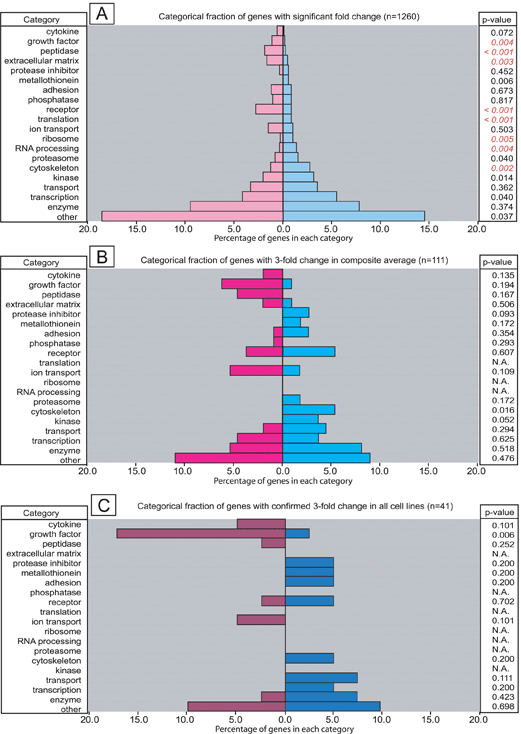
Figure 5. Distribution of genes with increased and decreased signals by functional annotation categories
A: 1,260 unique genes with significant increase (n=607) or decrease (n=653) in signal intensity (Figure 3D). B: 111 genes from Table 3 that had significant fold change increase (n=58) or decrease (n=53) in the composite data greater than three fold. C: 41 genes from Table 2A,B that exceeded a three fold increase (n=23) or decrease (n=18) in signal in all three TM cell cultures. Gene classifications are shown on the left Y-axis; p values on the right Y-axis are from χ2 test comparing the number of increased and decreased genes in each category to the number of increased and decreased genes in the combined data set. Significant p values are in red italics (p<0.005). Genes were classified as described in Methods. Bars to the right of the center line indicate increased signal and bars to the left indicate decreased signal.