![]() Figure 7 of
Mader, Mol Vis 2006;
12:915-930.
Figure 7 of
Mader, Mol Vis 2006;
12:915-930.
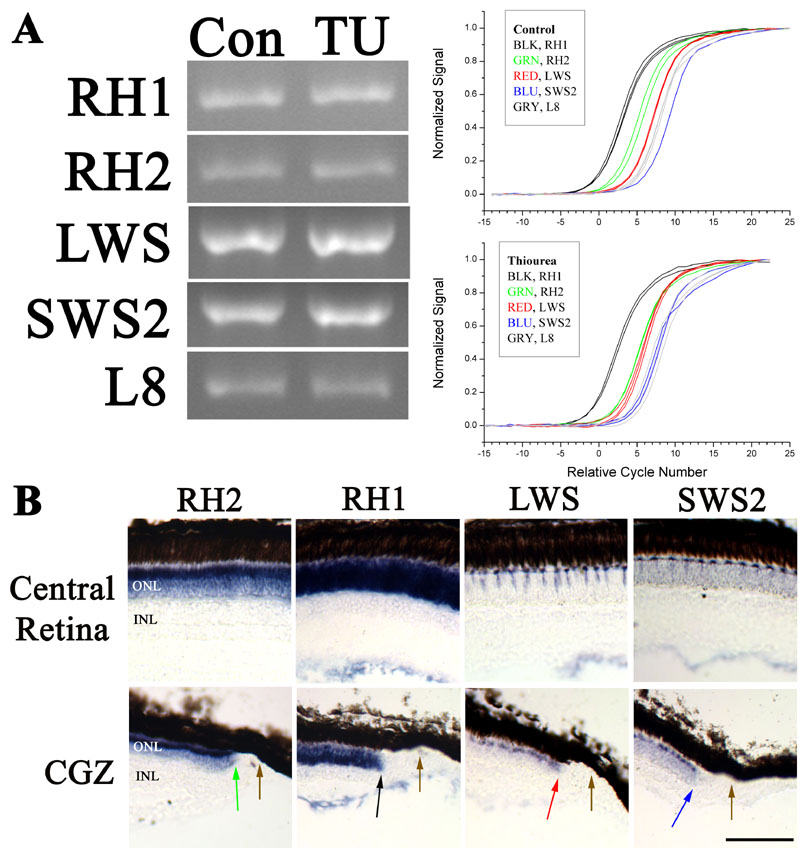
Figure 7. Opsin expression in control and hypothyroidic flounder retina
A: RT-PCR and qPCR analysis of retinal opsin expression in control and hypothyroidic (TU-exposed) postmetamorphic flounder. Left, Gel electrophoresis of RT-PCR-amplified, partial-length products encoding RH1, RH2, LWS, SWS2, and 60S ribosomal protein L8. For each product there is no overt difference in band intensity between the control (Con) and hypothyroidic (TU) conditions. Right, Normalized growth curves from qPCR analyses. The curves are plotted with respect to the mean threshold value derived for RH1 (black curve), which is defined as abscissa value zero [43]. There are no statistically significant differences in the levels of RH2 (green), LWS (red), SWS2 (blue), or L8 (grey) transcripts relative to RH1 between the control and hypothyroidic conditions (p>0.05). B: In situ hybridization analysis of opsin expression in hypothyroidic postmetamorphic flounder retina. The displayed sections were derived from flounder exposed to TU for 30 days, and the sections were sequentially collected. The illustrated regions of retina (top, central retina; bottom, retinal margin including the CGZ) are indicated to the left of each row, and the mRNA target of the cRNA probes (all anti-sense) is indicated along the top of each column. The labeling patterns for all opsins in central retina matched those observed in control postmetamorphic retinas (Figure 4) [32]. At the CGZ the RH2-expressing photoreceptor (green arrow) nearest to a landmark at the cytogenic region (termination of the IPL; brown arrow) is closer to the landmark than the nearest RH1- (black arrow), LWS- (red arrow), or SWS2-(blue arrow) expressing photoreceptor. This labeling pattern differs quantitatively from that observed for control retina (Figure 9) [32]. Scale bar represents 100 μm.