![]() Figure 11 of
Mader, Mol Vis 2006;
12:915-930.
Figure 11 of
Mader, Mol Vis 2006;
12:915-930.
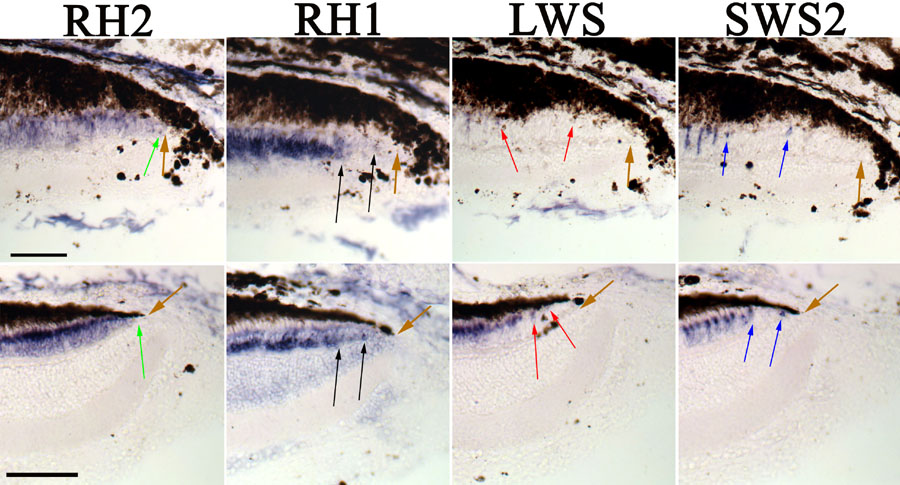
Figure 11. Opsin expression at lesion edges following termination of induced hypothyroidism
In the illustrated examples the flounder was rendered hypothyroidic for 26 days, followed by 14 days in normal salt water. For each row of images the cryosections were sequentially collected at the lesion site, and the expression patterns of the RH2, RH1, LWS, and SWS2 opsins were determined with in situ hybridization. In each panel the location of the lesion edge/cytogenic region is indicated by the brown arrow; locations of opsin-expressing cells are indicated by the green, black, red and blue arrows. The RH2-expressing cells are in close proximity to the cytogenic region, as in Figure 7B and Figure 10. An "extra" set of RH1-, LWS-, and SWS2-expressing cells (right-most black, red, and blue arrows, respectively) are located in the region of retina that, in the hypothyroidic condition, corresponds to the premetamorphic phenotype (compare with Figure 10). Because these "extra" opsin-expressing cells are phenotypically appropriate for normal postmetamorphic retina, their presence suggests a restoration of the TH-dependent control of photoreceptor production normally associated with postmetamorphic retinal cytogenesis. Scale bars represent 100 μm.